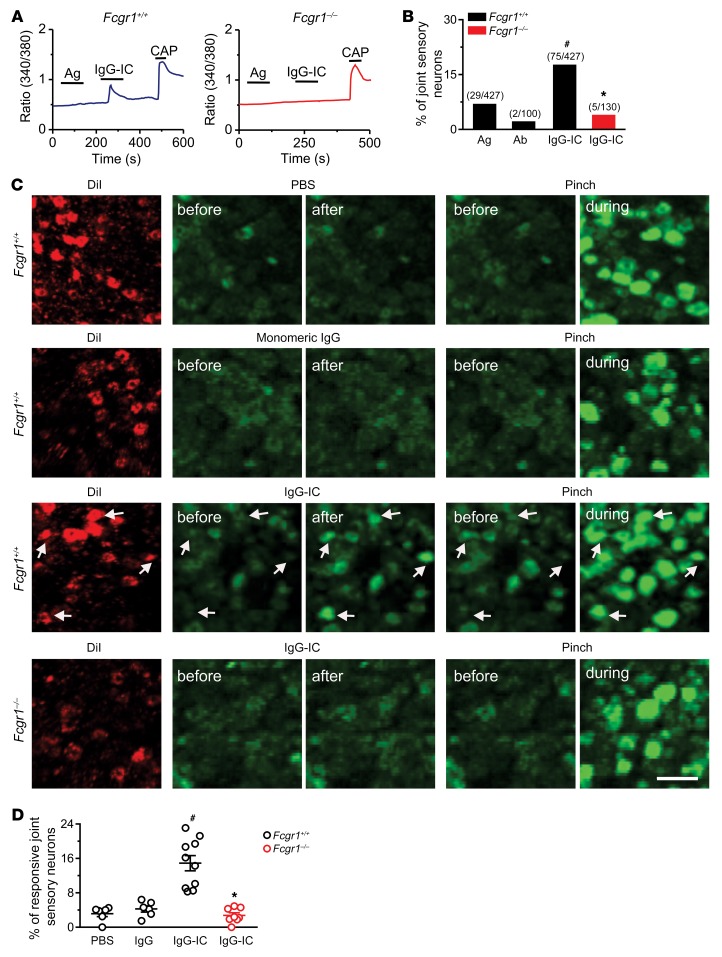
Figure 2. IgG-IC directly activates joint sensory neurons through FcγRI in vitro and in vivo.
(A) Representative traces of Ca2+ responses evoked by antigen (Ag) alone (BSA), IgG-IC (1 μg/mL, 2 minutes), and capsaicin (CAP; 1 μM, 10 seconds) in joint-innervating (DiI-labeled) DRG neurons from Fcgr1+/+ (left) and global Fcgr1–/– (right) mice. (B) Quantitative analysis showed that IgG-IC, but not Ag or antibody (Ab; anti-BSA) alone, evoked Ca2+ responses in a larger proportion of DiI-labeled joint sensory neurons from Fcgr1+/+ mice than those from Fcgr1–/– mice. *P < 0.05 vs. Fcgr1+/+, #P < 0.05 vs. Ag; χ2 test. Number of responsive neurons and total number tested are in parentheses. (C) Left: Representative DiI fluorescence (red) in L4 DRG neuronal cell bodies in PirtCre-GCamp6 mice that were either Fcgr1+/+ or Fcgr1–/–, retrogradely labeled with ankle joint injection of DiI (2 mg/mL; 8 μL in saline). Right: GCAMP6 fluorescence (green) in the same fields before and after stimulation of the RF with the indicated stimuli. White arrows show DRG neurons from Fcgr1+/+ mice exhibiting an increase in GCAMP6 fluorescence when the ankle was squeezed with blunt forceps and 4 minutes after IgG-IC (100 μg/mL; 10 μL) was injected into ankle joint cavity, but not after vehicle (PBS; 10 μL) or monomeric IgG (100 μg/mL; 10 μL) was injected. By contrast, little or no increase in GCAMP6 fluorescence was induced by IgG-IC in joint sensory neurons from Fcgr1–/– mice. Scale bar: 50 μm. (D) Quantitative analysis of Ca2+ responses to PBS (n = 6 mice), monomeric IgG (n = 6 mice), and IgG-IC (n = 10 mice) in joint sensory neurons of Fcgr1+/+ mice and IgG-IC in Fcgr1–/– mice (n = 8 mice). *P < 0.05 vs. Fcgr1+/+, #P < 0.01 vs. PBS; 1-way ANOVA followed by Tukey’s test.

