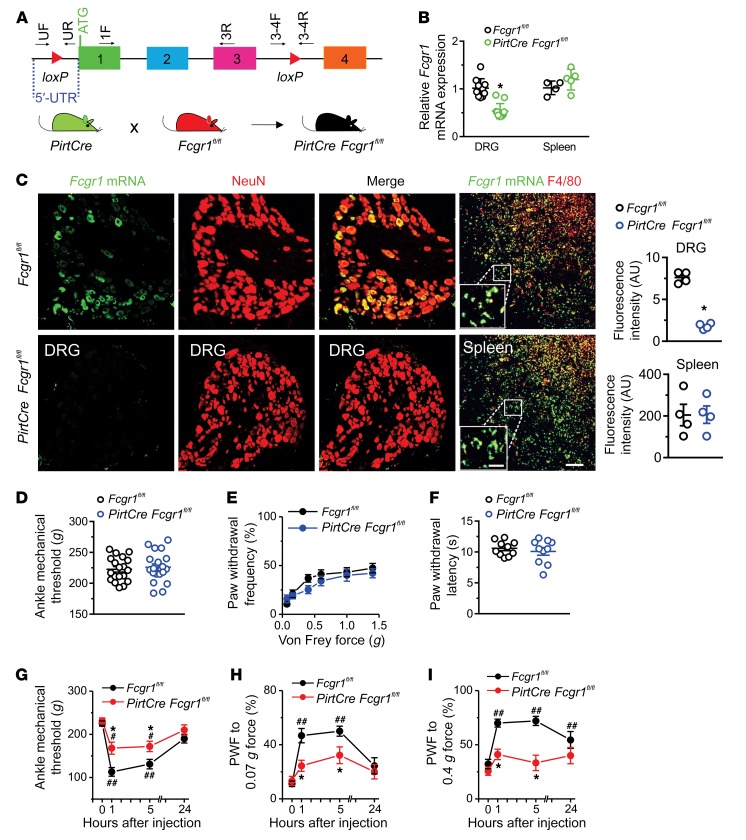
Figure 5. Neuronal FcγRI contributes to IgG-IC–induced acute nocifensive behaviors.
(A) Strategy for generation of primary sensory neuron–selective Fcgr1-knockout mice. Two loxP sites were inserted 5′ to exon 1 and 3′ to exon 3 of the Fcgr1 gene, respectively. Primers UF and UR and primers 3-4F and 3-4R, respectively, were used to confirm correct loxP insertions at each site. Deletion of the Fcgr1 gene in primary sensory neurons was achieved by crossing of Fcgr1fl/fl mice with PirtCre mice. (B) RT-qPCR analysis using primers 1F and 3R from A revealed a significant reduction in Fcgr1 mRNA expression in DRG tissue (n = 10–11 mice per group) but not in spleen of PirtCre Fcgr1fl/fl mice (n = 4–5 mice per group) compared with Fcgr1fl/fl controls. (C) Representative ISH image of DRG and spleen. Scale bar: 50 μm. Inset shows area of high-power magnification; scale bar: 20 μm. Quantification shows reductions in Fcgr1 mRNA expression in DRG neurons (NeuN) but not in spleen macrophages (F4/80) of PirtCre Fcgr1fl/fl mice compared with Fcgr1fl/fl controls. n = 4 mice per group; *P < 0.05 vs. Fcgr1fl/fl controls. For B and C, unpaired Student’s t test was used. (D–F) No significant differences were observed between genotypes in basal mechanical sensitivity in the ankle (D) or hind paw (E), or in basal thermal sensitivity in the hind paw (F). n = 10–19 mice per group; P > 0.05; unpaired Student’s t test or 2-way ANOVA for repeated measures followed by Bonferroni’s post hoc test. (G–I) Time course of mechanical threshold in the ankle and paw withdrawal frequency (PWF) to 0.07 and 0.4 g force before and after i.a. injection of IgG-IC (100 μg/mL; 10 μL). n = 9 mice per group; *P < 0.05 vs. Fcgr1fl/fl controls; #P < 0.05, ##P < 0.01 vs. before injection; 2-way ANOVA for repeated measures followed by Bonferroni’s post hoc test.

