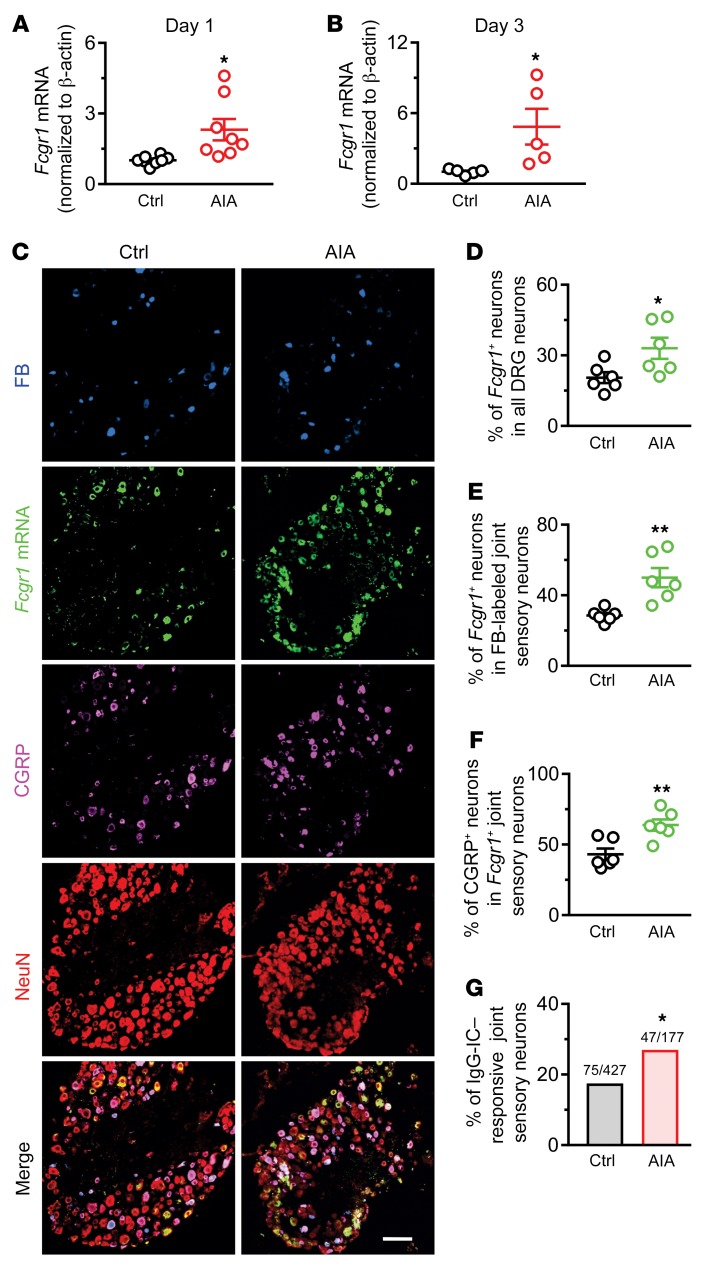
Figure 6. AIA upregulates the expression and function of FcγRI in mouse DRG neurons.
(A and B) RT-qPCR analysis of Fcgr1 mRNA expression normalized to that of Actb (β-actin) in the DRG of control (Ctrl) and AIA mice on days 1 (A; n = 8 mice per group) and 3 (B; n = 5 mice per group) after challenge. *P < 0.05 vs. control; unpaired Student’s t test. (C) Representative lumbar DRG ISH for Fcgr1 and immunostaining for peripherin, NF200, and CGRP, and the merged image from control (Ctrl; n = 6) and AIA (n = 6) mice. DRG neurons innervating ankle joint were retrogradely labeled with FB. Scale bar: 50 μm. (D) Percentage of Fcgr1+ neurons among all DRG neurons in control and AIA mice. (E) Percentage of Fcgr1+ joint sensory neurons in control and AIA mice. (F) Percentage of CGRP+ neurons among Fcgr1+ joint sensory neurons in control and AIA mice. n = 6 mice per group; *P < 0.05; **P < 0.01 vs. control; unpaired Student’s t test. (G) Quantitative analysis of Fura-2 Ca2+ imaging shows that a larger proportion of DiI-labeled joint sensory neurons from AIA mice responded to IgG-IC (1 μg/mL, 2 minutes) compared with those from control mice. *P < 0.05 vs. control; χ2 test. Numbers of responsive neurons divided by total number tested are noted above graphs.

