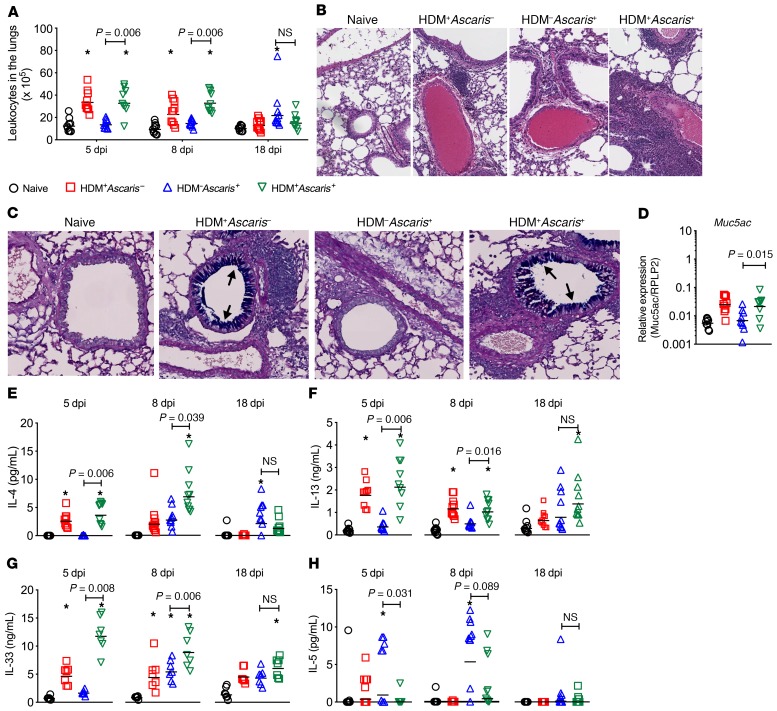
Figure 2. Allergic sensitization followed by Ascaris infection drives a marked influx of inflammatory cells to the lungs, increased mucus production, and a robust type 2 immune profile.
Cellularity quantification (A), representative H&E perivascular and peribronchial histological analysis (original magnification, ×8) of the inflammatory influx of leukocytes at 8 dpi (B), AB/PAS staining (original magnification, ×8) for mucus production by the goblet cells in the lung epithelium (in blue; arrows) at 8 dpi (C), relative gene expression of Muc5ac (D), and pulmonary tissue levels of IL-4 (E), IL-13 (F), IL-33 (G), and IL-5 (H) in the lung’s homogenates of naive HDM–Ascaris– (black circles) (a), HDM+Ascaris– (red squares) (b), HDM–Ascaris+ (blue triangles) (c), and HDM+Ascaris+ (green triangles) (d) BALB/c mice at day 5 (n = 9 mice per group), day 8 (n = 10 mice per group), and day 18 (n = 10 mice per group). Each symbol represents a single mouse, and the horizontal bars are the GMs. P value is indicated in each graph. Kruskal-Wallis test followed by Dunn’s multiple-comparisons test was used for all comparisons; *significantly different (P < 0.05) from naive (HDM–Ascaris–) group.

