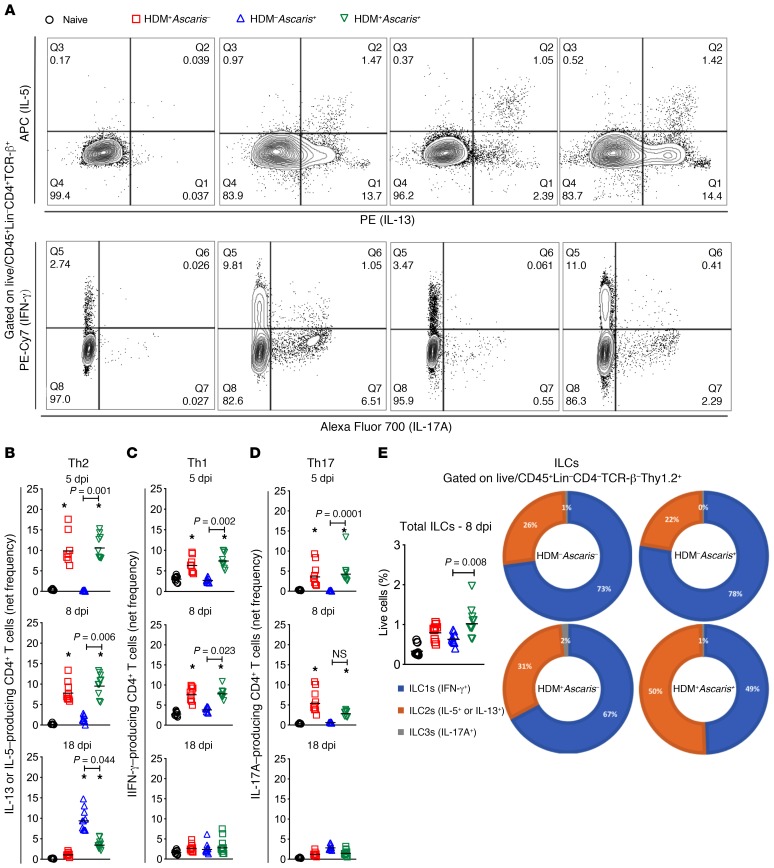
Figure 3. HDM sensitization followed by Ascaris infection drives a strong innate and adaptive type 2 immunity in the lungs.
(A) Representative flow cytometry dot plot of lung homogenates, gated on Lin–CD45+TCR-β+CD4+ T cells, showing the frequencies of IL-5 and IL-13 (top) and IFN-γ and IL-17 (bottom) in the different groups at day 8. (B–D) The net frequency of IL-5+ or IL-13+ CD4+ Th2 cells (B), IFN-γ+ CD4+ Th1 cells (C), and IL-17A+ CD4+ Th17 cells (D) was assessed at different time points: day 5 (n = 9 mice per group), day 8 (n = 10 mice per group), and day 18 (n = 10 mice per group). Boolean analysis was performed to exclude multifunctional CD4+ T cells expressing IL-5, IL-13, IFN-γ, and IL-17 simultaneously. (E) Frequency of total innate lymphoid cells (ILCs) gated as CD45+Lin–CD4–TCR-β–Thy.1.2+ in the different groups at day 8 of infection, as well as the proportion of ILC1s, ILC2s, and ILC3s, based on the expression of the signature cytokines IFN-γ, IL-5/IL-13, and IL-17A, respectively, after PMA/ionomycin stimulation. Each symbol represents a single mouse, and the horizontal bars are the GMs. Net frequency of CD4+ T cells was calculated by subtraction of the baseline frequency (nonstimulated) from the frequency following stimulation with PMA/ionomycin. P values are indicated in each graph. Differences were considered statistically significant at P < 0.05 by Kruskal-Wallis test followed by Dunn’s multiple-comparisons test, used for all comparisons; *significantly different (P < 0.05) from naive (HDM–Ascaris–) group.

