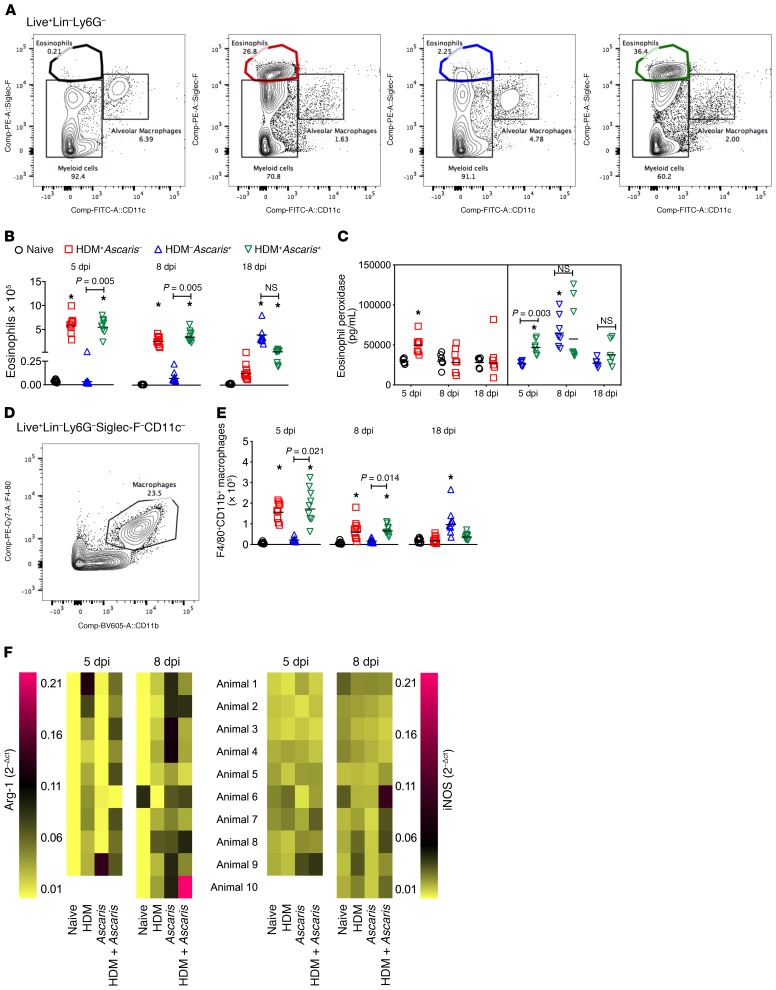
Figure 4. Ascaris infection in preallergic animals is associated with an eosinophil-, M2 macrophage–, and mucus-rich environment in the lungs.
(A) Representative flow cytometry dot plots of the lungs showing the frequencies of Siglec-F+CD11c– eosinophils at day 8. (B and C) Absolute number of eosinophils at different time points (B), and eosinophil activation assay by quantification of eosinophil peroxidase (EPO) levels (C). (D) Representative flow cytometry dot plot of the lungs showing the frequencies of CD11b+F4/80+ macrophages at day 8. (E) Absolute number of macrophages at different time points: day 5 (n = 9 mice per group), day 8 (n = 10 mice per group), and day 18 (n = 10 mice per group). (F) Heatmap analysis to compare gene expression of arginase-1 (Arg-1) and iNOS in the lungs of mice from all groups at day 5 (n = 9 mice per group) and day 8 (n = 10 mice per group). In the heatmap, each row represents the expression level of Arg-1 and iNOS per animal, and the columns represent the different groups. Pink represents highly expressed; yellow means low expression value. Each symbol represents a single mouse, and the horizontal bars are the GMs. P values are indicated in each graph. Differences were considered statistically significant at P < 0.05 by Kruskal-Wallis test followed by Dunn’s multiple-comparisons test, used for all comparisons; *significantly different (P < 0.05) from naive (HDM–Ascaris–) group. Wilcoxon matched-pairs test was used for the gene expression analysis between HDM+Ascaris– mice and HDM+Ascaris+ mice.

