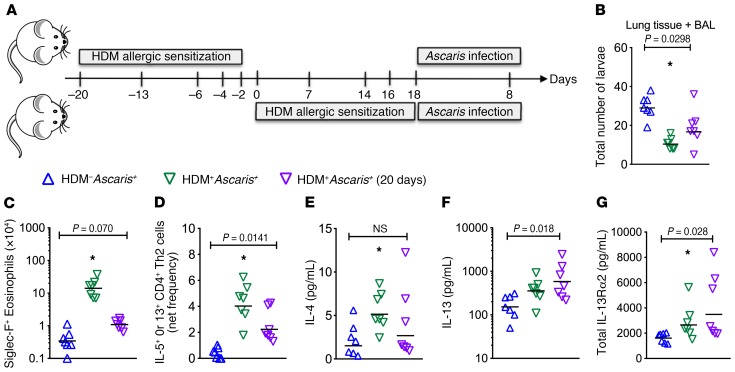
Figure 7. HDM allergic sensitization induces a persistent protective type 2 immunity followed by later Ascaris infection.
(A) Experimental design scheme for unsensitized mice followed by Ascaris infection, HDM–Ascaris+ (blue triangles) (n = 7 mice); and HDM allergic sensitization followed by Ascaris infection at 2 different time points: HDM+Ascaris+ (green triangles) (n = 7 mice), infected right after the last sensitization with HDM, and HDM+Ascaris+ (20 days) (purple triangles) (n = 7 mice), infected 20 days after the last sensitization with HDM. (B) Total parasite burden in the lung tissue and BAL at day 8 of infection. (C and D) Characterization of the lung-specific immune response by flow cytometry, showing eosinophils (C) and IL-5+ or IL-13+ CD4+ Th2 cell frequency (D). (E–G) IL-4, IL-13, and IL-13Ra2 levels quantified in the lung homogenates of each group. Each symbol represents a single mouse, and the horizontal bars are the GMs. P values are indicated in each graph. Kruskal-Wallis test followed by Dunn’s multiple-comparisons analysis was used for differences among the groups; *significantly different (P < 0.05) from HDM–Ascaris+ group by the same analyses.

