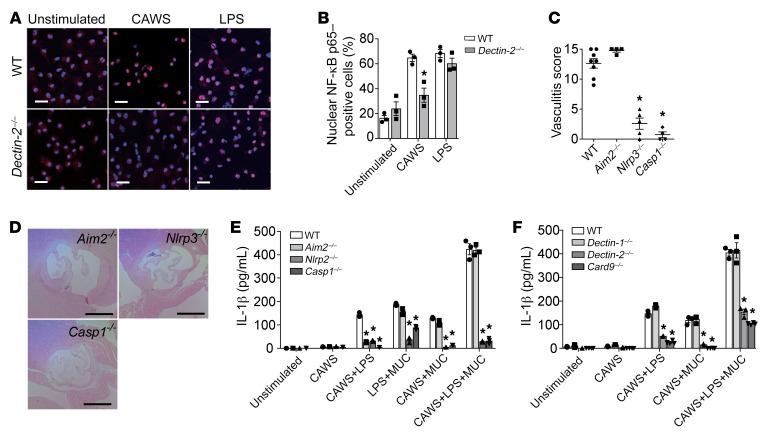
Figure 8. CAWS activates the NLRP3 inflammasome and promotes IL-1β production via Dectin-2.
(A) Representative immunofluorescent staining showing NF-κB p65 (red) nuclear translocation in WT and Dectin-2–/– BMDMs stimulated for 60 minutes with CAWS (10 μg/mL) or LPS (1 μg/mL). Cell nuclei were detected by DAPI (blue). Similar results are obtained from 3 independent experiments. Scale bars: 20 μm. (B) Quantitation of NF-κB p65 nuclear translocation in the indicated groups. Results are expressed as the percentage of cells with NF-κB p65–positive nuclei versus total cells. Similar results were obtained from 3 independent experiments (mean ± SEM, n = 3 per group, *P < 0.01 versus WT). (C) Vasculitis scores of WT, Aim2–/–, NLRP3–/–, or Caspase-1–/– mice on day 28 after CAWS injection (mean ± SEM, n = 4–8 mice per group, *P < 0.0001 versus WT). (D) H&E–stained sections of aortic root lesions isolated from Aim2–/–, NLRP3–/–, or Caspase-1–/– mice on day 28. Scale bars: 400 μm. (E) BMDCs from WT, Aim2–/–, NLRP3–/–, or Caspase-1–/– mice were stimulated with CAWS with or without inflammasome stimulators (LPS and MUCs) for 18 hours, and IL-1β release was assessed by ELISA (mean ± SEM, n = 3 per group, *P < 0.0001 versus WT). (F) BMDCs from Dectin-1–/–, Dectin-2–/–, or Card9–/– mice were stimulated with CAWS with or without inflammasome stimulators (LPS and MUC) for 18 hours, and IL-1β release was assessed by ELISA (mean ± SEM, n = 3–4 per group, *P < 0.0001 versus WT). P values were calculated using unpaired 2-tailed Student’s t test (B) or 1-way ANOVA with Dunnett’s post hoc test (C, E, and F).

