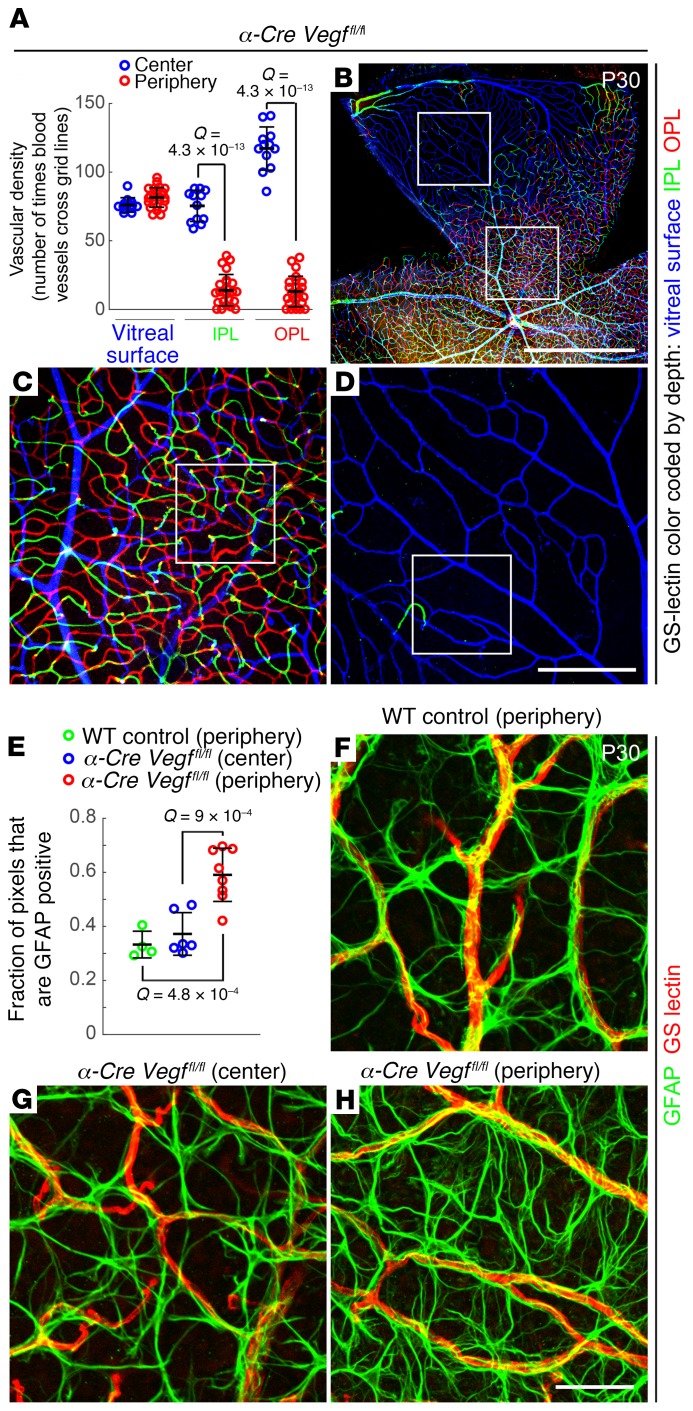
Figure 3. Loss of intraretinal but not surface vasculature with loss of intraretinal VEGF.
(A–D) Vascular density in α-Cre Vegffl/fl retinas at P30. (A) Quantification of vascular density in the center (blue; little or no Cre-mediated recombination) and periphery (red; intraretinal Cre-mediated recombination) for each of the 3 vascular layers (vitreal surface, IPL, and OPL) in α-Cre Vegffl/fl retinas. In A, each symbol is the quantification from one 500-μm × 500-μm area; bars represent the mean ± SD and Q values were calculated with a 2-tailed unequal variance t test adjusted for multiple comparisons using the method of Benjamini and Hochberg (52). (B–D) GSL-stained vasculature at low magnification (B) and at intermediate magnification (C) and (D), corresponding, respectively, to the lower and upper labeled squares in B. The GSL signal is color coded by depth with the vitreal surface in blue, the IPL in green, and the OPL in red. Scale bars: 1 mm (B)and 200 μm (D). (E–H) Surface astrocyte density in α-Cre Vegffl/fl retinas at P30. E shows the quantification of the density of astrocyte processes (GFAP immunostaining) in the periphery of a WT retina (green) and in the center (blue) and periphery (red) of α-Cre Vegffl/fl retinas. Each symbol is the quantification from one 200-μm × 200-μm area; bars represent the mean ± SD, and Q values were calculated with a 2-tailed unequal variance t test adjusted for multiple comparisons using the method of Benjamini and Hochberg (52). Examples of the vitreal surface of WT peripheral retina and α-Cre Vegffl/fl central and peripheral retina following GFAP and GSL staining are shown at high magnification in F–H (scale bar: 50 μm). Images in G and H correspond to the labeled squares in C and D, respectively.

