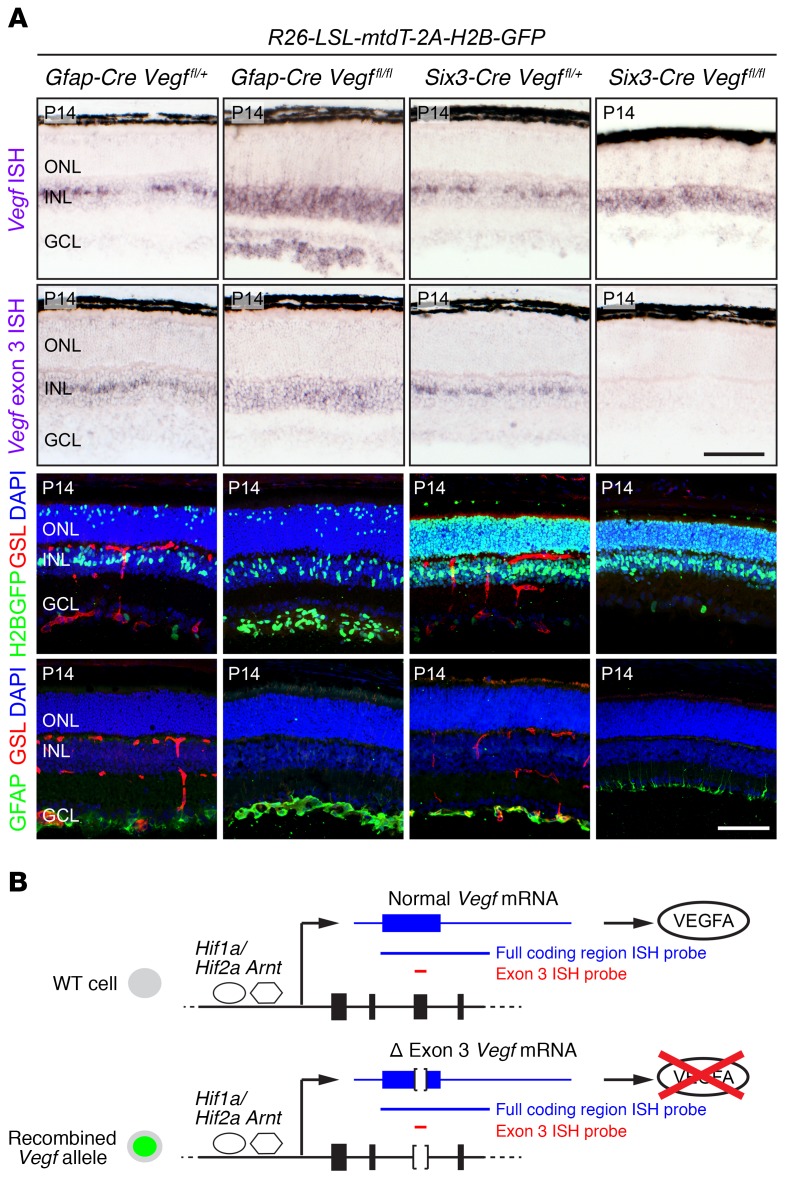
Figure 7. Contrasting responses of Vegf gene expression and astrocyte proliferation/migration with loss of Vegf in astrocytes versus all retinal cells.
(A) Retina sections at P14 from mice carrying the R26-LSL-mtdT-2A-H2B-GFP reporter, Gfap-Cre or Six3-Cre drivers, and the indicated combinations of Vegf alleles. Top 2 rows show ISH for Vegf transcripts. First row, ISH with the full coding region probe detects transcripts from both the unrecombined and the recombined conditional allele. Second row, ISH with the exon 3–specific probe detects only unrecombined transcripts. Third row, localization of Cre activity visualized with the R26-LSL-mtdT-2A-H2B-GFP reporter, leading to production of H2B-GFP. Fourth row, astrocytes visualized with GFAP immunostaining. Retinal vasculature, visualized with GSL staining, is missing from Gfap-Cre Vegffl/fl and Six3-Cre Vegffl/fl retinas. Scale bars: 100 μm. (B) HIF-stimulated transcription of the WT (top) and KO (i.e., exon 3 deleted; bottom) Vegf alleles in hypoxic cells and the structures of WT and exon 3–deleted Vegf transcripts. In the diagram of the Vegf gene, the first 4 exons are shown as black rectangles. The full coding region ISH probe is shown as a blue line and the exon 3–specific ISH probe is shown as a red line.

