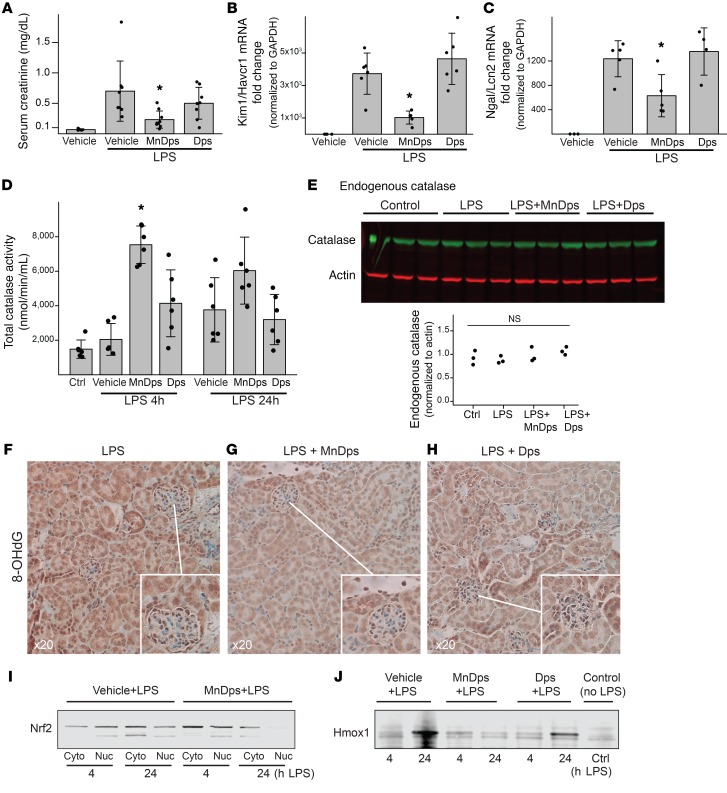
Figure 3. MnDps reduces endotoxin-induced renal tissue damage.
(A) Serum creatinine levels 24 hours after 5 mg/kg LPS i.p. with 18 mg/kg unmodified Dps, MnDps, or PBS vehicle i.v. Administration of Dps, MnDps, or vehicle was done via tail vein immediately before LPS i.p. injection. *P < 0.05 vs. LPS+vehicle or LPS+Dps, 1-way ANOVA followed by pairwise t tests with corrections for multiple testing using the Benjamini and Hochberg procedure. n = 8 per condition. Error bars show SD. (B and C) Kidney tissue Kim1/Havcr1 and Ngal/Lcn2 levels under indicated conditions 24 hours after 5 mg/kg LPS i.p., as determined with quantitative PCR. n = 4–5 per condition as depicted with dot plots. *P < 0.05 vs. LPS+vehicle or LPS+Dps. (D) Total catalase activity levels (endogenous and exogenous catalase activities) are shown for indicated conditions. *P < 0.05 vs. LPS 4 hours + vehicle. (E) Endogenous protein catalase levels were determined by Western blot. LPS, 4 hours; catalase, MW, 60 kDa; actin, 42 kDa, n = 3 per condition. (F–H) Staining for 8-OHdG, a marker of oxidative stress/oxidized DNA and RNA, under indicated conditions (LPS 4 hours). Insets provide enlarged views, ×40. n = 3 per condition. (I) Mice were treated under indicated conditions, and kidney tissues were fractionated for cytoplasm and nuclei and analyzed by Western blot for Nrf2 (MW, ~100 kDa). MnDps treatment reduced nuclear translocation of Nrf2 as compared with vehicle control after LPS challenge for indicated durations. (J) Western blot analysis of kidney tissues for Hmox1 under indicated conditions (MW, 32 kDa). Induction of Hmox1 was limited with MnDps treatment.

