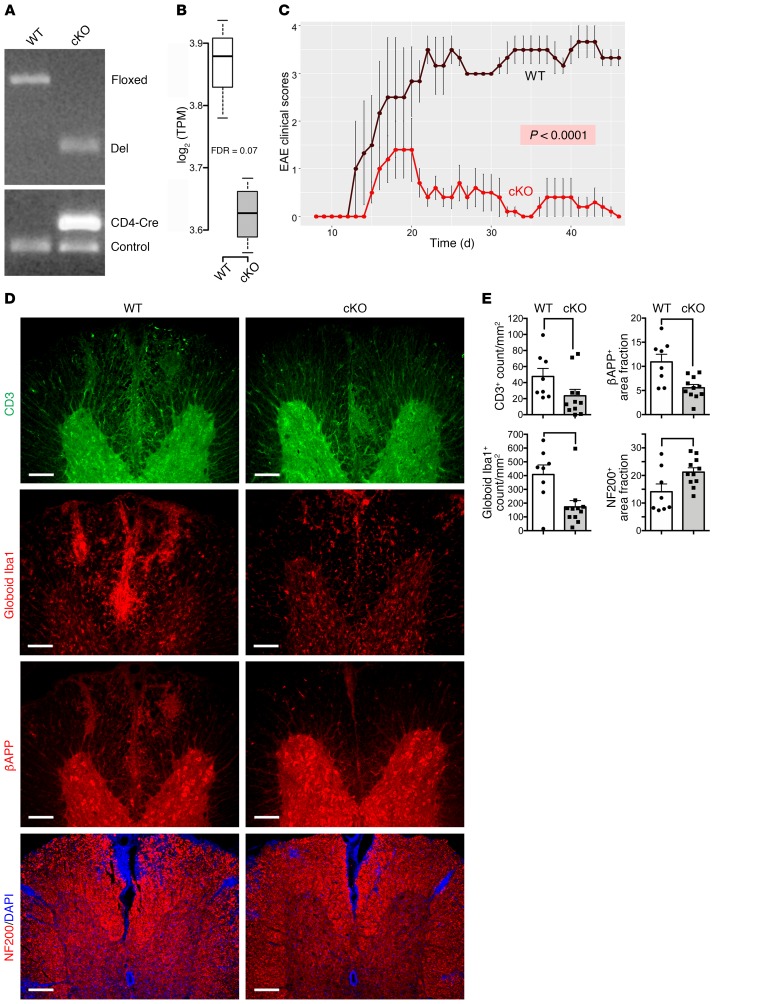
Figure 2. Deletion of Kdm6a in CD4+ T cells protects mice from EAE.
(A) Genomic PCR for isolated CD4+ T cells from EAE mice showed successful deletion of Kdm6a in cKO mice homozygous for the KO allele. (B) In cKO mice, RNA expression of Kdm6a was downregulated in CD4+ T cells. RNA expression levels of Kdm6a were graphed with log2-transformed TPM normalization. In box-and-whisker plot, thick lines inside the boxes represent the median of the data. The lower and upper ends of boxes show quantiles (25% and 75%), and whiskers show the minimum and maximum values. FDR was calculated using edgeR. (C) cKO mice showed decreased EAE severity scores compared with WT littermates. n = 4 WT; n = 5 cKO. P < 0.0001, repeated measures 1-way ANOVA. Additional EAE experiments are shown in Table 1. (D) Representative ×10 images of the ventral spinal cord of EAE in WT and cKO stained with antibodies for CD3 (green), Iba1 (red), βAPP (red), and NF200 (red) costained with DAPI (blue). Scale bars: 100 μm. (E) Dot plots show a decrease in cKO for CD3+ cell count (P = 0.03276), globoid Iba1+ cell count (P = 0.02593), and βAPP+ percentage area for axonal damage (P = 0.01207), and show an increase in cKO for NF200+ intact axonal count (P = 0.03276) in the white matter. n = 8 WT; n = 11 cKO. The height of columns represents mean, and error bars represent SEM. For each stain, P value was determined by Mann-Whitney U test.

