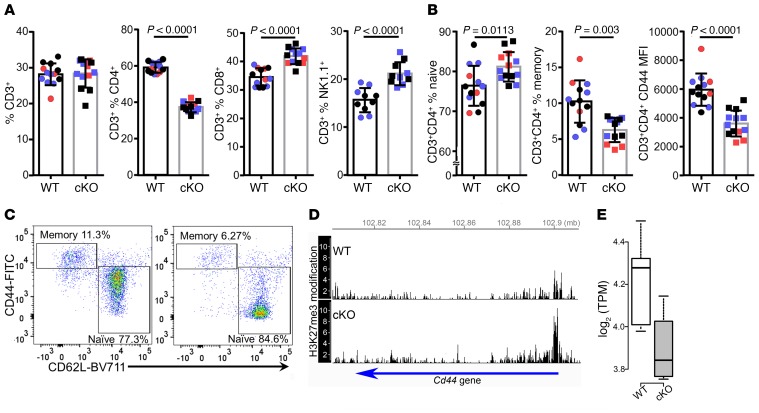
Figure 4. A shift toward a naive phenotype in CD3+CD4+ T cells from Kdm6a cKO as compared with WT healthy mice.
Spleens were collected from healthy female WT and Kdm6a cKO mice for flow cytometry analysis of single-cell suspensions in 3 separate experiments (Exp1, red; Exp2, purple; Exp3, black). (A) There was no significant difference in the percentage of CD3+ cells. However, there was a decrease in CD3+CD4+ and an increase in CD3+CD8+ and CD3+NK1.1+ T cells in the cKO. (B) Within the CD3+CD4+ population, there was an increase in naive T cells (CD44loCD62Lhi), a decrease in memory T cells (CD44hiCD62Llo), and a decrease in CD44 MFI in the cKO. P values were calculated by unpaired 2-tailed t test. Error bars represent SD. (C) Representative dot plots show CD3+CD4+ naive and memory T cell populations in WT (left) and cKO (right). (D) cKO mice have more repressive H3K27me3 modifications on Cd44 compared with WT. ChIP-Seq data for H3K27me3 modification in mature CD4 single-positive thymocytes from WT and cKO were obtained from the GEO database (GSE70795; ref. 38). Without Kdm6a (cKO), the amount of H3K27me3 modification was increased around the transcription start site. (E) In healthy CD4+ T cells, RNA expression of Cd44 was downregulated in cKO (FDR = 0.009, edgeR), consistent with the increase of repressive histone marks, with less H3K27me3 histone demethylase activity in cKO. In box-and-whisker plots, thick lines inside the boxes represent the median of the data. The lower and upper ends of boxes show quantiles (25% and 75%), and whiskers show the minimum and maximum values.

