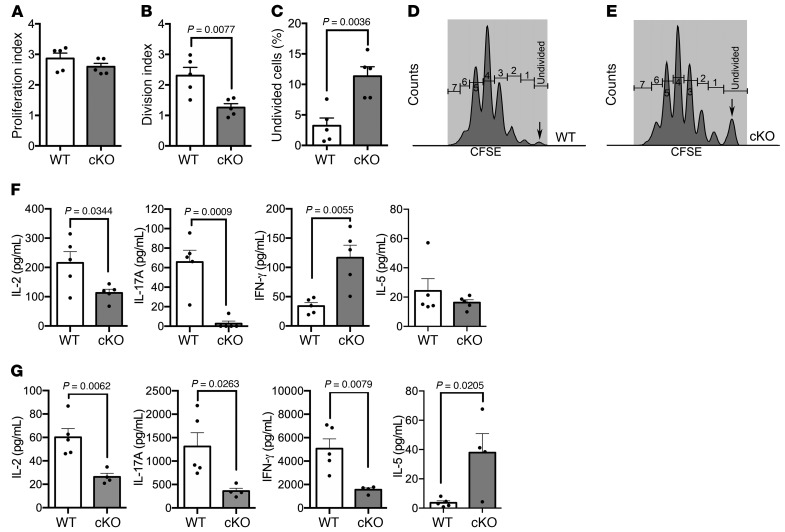
Figure 5. T cell proliferation and cytokine production in Kdm6a cKO and WT mice.
(A–E) Healthy female CD4+ T cells from WT (n = 5) and cKO (n = 5) mice were stained with CFSE and then cultured with anti-CD3/CD28 for 4 days, followed by flow cytometric analysis. (A) The proliferation index was similar between WT and cKO CD4+ T cells. (B) The division index of cKO CD4+ T cells was lower than that of WT. (C) There was a higher percentage of undivided CD4+ T cells in cKO than WT. (D-E) Representative CFSE histograms of viable CD4+ T cells in WT (D) and cKO (E). (F) Healthy female CD4+ T cells from WT (n = 5) and cKO (n = 5) were cultured with anti-CD3/CD28 antibodies for 36 hours. Analysis of supernatants showed a decrease in IL-2 and IL-17A, while IFN-γ was significantly increased in cKO compared with WT, with no difference in IL-5. (G) Female EAE lymphocytes were isolated from WT (n = 5) and cKO (n = 4) mice at EAE day 29 and cultured with autoantigen for 36 hours. Analysis of supernatants showed a significant decrease of IL-2, IL-17A, and IFN-γ, while IL-5 was significantly increased in cKO compared with WT. P values were calculated by unpaired, 2-tailed t test. Error bars represent SEM.

