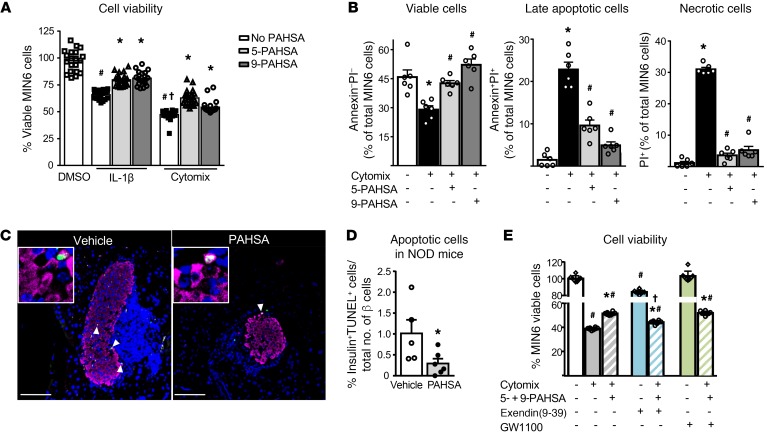
Figure 4. PAHSA treatment increases islet β cell viability and attenuates cytokine-induced β cell death.
(A) MIN6 cells were treated with either diluent or IL-1β (10 ng/mL) or cytomix (TNF-α plus IL-1β plus IFN-γ; 10 ng/mL each) for 40 hours in the presence of 5- or 9-PAHSA (5 μM each). The percentage of viable β cells was measured by MTT assay and calculated as the percentage of DMSO control (n = 24 wells/condition). #P < 0.05 versus control DMSO; †P < 0.05 versus control DMSO and IL-1β; *P < 0.05 versus the respective cytokine treatment. Data indicate the mean ± SEM. Differences between groups were assessed by ANOVA with Newman-Keuls multiple comparisons test. (B) MIN6 cells were treated with cytomix in the presence of 5- or 9-PAHSA (20 μM each) for 24 hours and stained with annexin V and PI. The effect of cytomix and PAHSAs on viability is expressed as a percentage of the total number of cells sorted (n = 6 wells/condition). *P < 0.05 versus control; #P < 0.05 versus cytomix. Data indicate the mean ± SEM. Differences between groups were assessed by ANOVA with Bonferroni’s multiple comparisons test. (C) Representative images of apoptotic cells in NOD mice treated for 15 weeks with vehicle or PAHSA starting at 4 weeks of age. Scale bars: 100 μm. Original magnification, ×256 (insets). (D) Female NOD mice were treated with vehicle or PAHSA for 15 weeks starting at 4 weeks of age, and the number of apoptotic cells was determined by TUNEL staining (n = 5–6/group). *P < 0.05 versus vehicle-treated mice. Data represent the mean ± SEM. Differences between groups were assessed by 2-tailed Student’s t test. (E) MIN6 cells were treated with either diluent or cytomix for 24 hours in the presence of 5- and 9-PAHSAs (20 μM each), exendin(9-39) (10 nM), and GW1100 (10 μM). The percentage of viable β cells was measured by MTT assay and calculated as the percentage of DMSO control (n = 8, for 12 wells/condition. #P < 0.05 versus control; *P < 0.05 versus cytomix alone and control alone; †P < 0.05 versus cytomix with PAHSA treatment. Data indicate the mean ± SEM. Differences between groups were assessed by ANOVA with Bonferroni’s multiple comparisons test.

