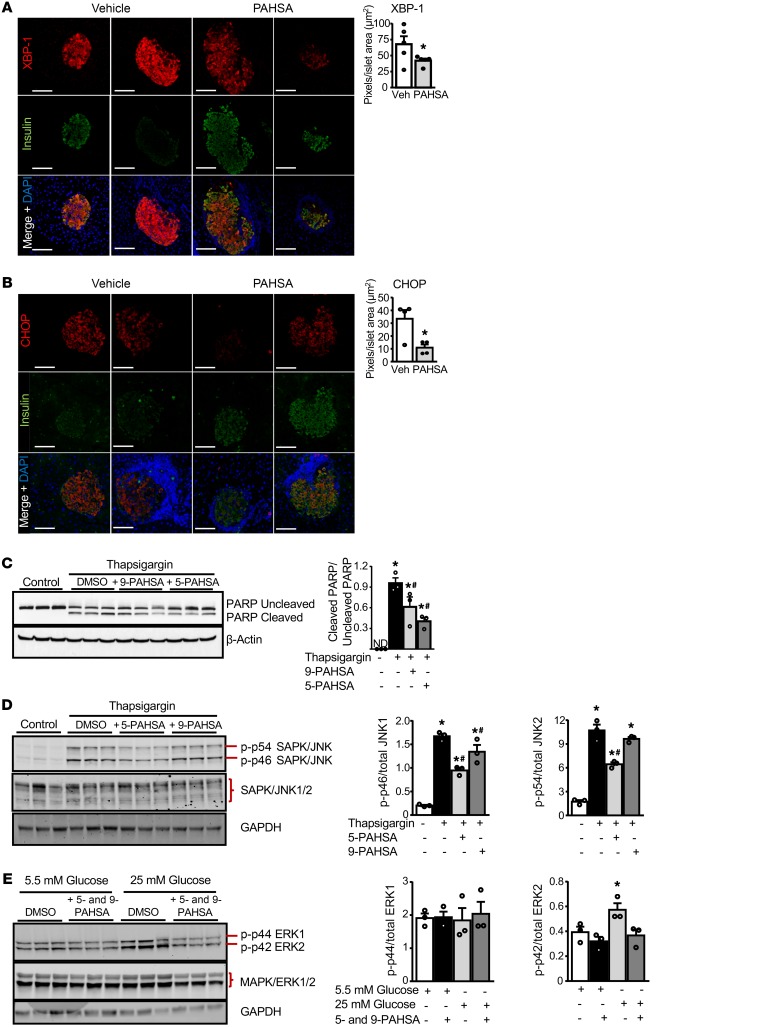
Figure 5. PAHSA treatment attenuates β cell death by inhibiting ER stress.
Female NOD mice were treated with vehicle or 5- and 9-PAHSA for 7 weeks starting at 4 weeks of age, and XBP-1 (A) and CHOP (B) intensities were determined by immunohistochemical analyses (n = 4–5 mice/group). *P < 0.05 versus vehicle-treated mice. Scale bars: 100 μm. Data indicate the mean ± SEM. Differences between groups were assessed by 2-tailed Student’s t test. (C) Human islets from nondiabetic donors were treated with thapsigargin (2 μmol/L) for 6 hours in the presence of 5-PAHSA or 9-PAHSA (20 μM each). Western blot analysis was performed with the cell lysates to determine PARP cleavage (n = 3 wells/condition, and each treatment condition had 250 islets in triplicate). Bar graphs show the densitometric analysis of the ratio of cleaved PARP to uncleaved PARP for each condition. *P < 0.05 versus control DMSO; #P < 0.05 versus thapsigargin. ND, not determined. MIN6 cells were treated with thapsigargin (0.5 μM) for 6 hours (D) or physiological glucose (5.5 mM) or high glucose (25 mM) for 24 hours (E) in the presence of 5- and/or 9-PAHSA (20 μM each). All conditions contained DMSO. Western blot analysis was performed to determine phosphorylation of JNK1/2 and ERK1/2 (n = 3 wells/condition). Bar graphs show the densitometric analysis of the ratio of p-JNK1 or p-JNK2 to the corresponding total JNK1 or JNK2 (D) and p-ERK1 or p-ERK2 to the corresponding total ERK1 or ERK2 (E) for each condition. SAPK, stress-activated protein kinase. *P < 0.05 versus no thapsigargin (D) or versus 5.5 mM glucose (E); #P < 0.05 versus thapsigargin (D). Densitometric analyses of the Western blots are an average of 3 lanes per condition. Data in C–E indicate the mean ± SEM. Differences between groups were assessed by ANOVA with Newman-Keuls multiple comparisons test.

