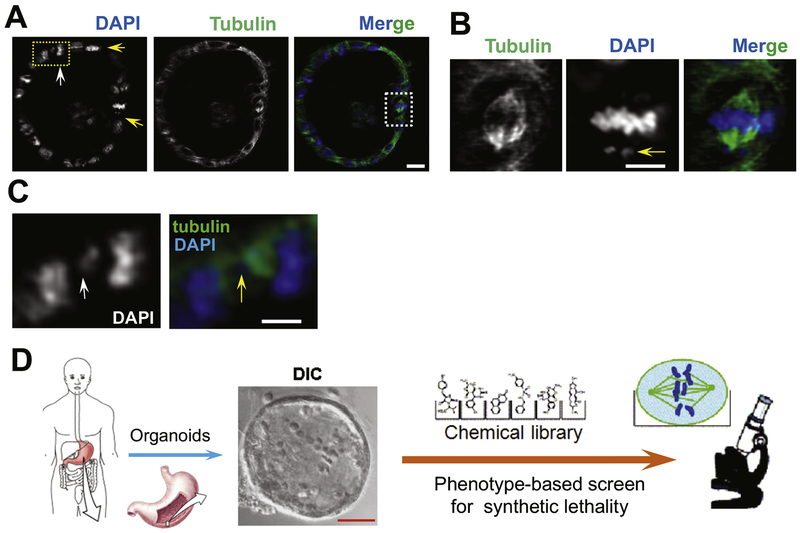
Figure 4.
Gastric stem cell division and plasticity and parietal cell functions in gastric organoids. (A) Non-secreting mouse gastric organoids were maintained in cimetidine and fixed for immunocytochemical staining of α-tubulin (green), and 4′,6-diamidino-2-phenylindole (DAPI) (blue). The light-sheet micrograph shows 4 mitotic cells with apparent different spindle orientations. Two metaphase-like cells are indicated by 2 yellow rows. Insets show 1 prometaphase (yellow arrow) and 1 aberrant anaphase-like cell with apparent perturbations of chromosome segregation (indicated by yellow arrow). Visualization of chromosome segregation in gastric organoids can be used to study chromosome stability and morphology of cancer cells. Light-sheet micrography of gastric epithelial and stem cells can be used to study their responses to different extracellular cues or therapeutic agents. For example, organoids derived from gastric cancer cells of patients might be used to identify the most effective treatments. Real-time spectral imaging could be used to study the effects of different combinations of agents. Scale bar = 20 μm. (B) Magnified image from (A). This mitotic cell has a lagging chromosome and spindle orientation error (arrow). Scale bar = 10 μm. (C) Magnified image from (A). This anaphase cell has a chromosome bridge readily apparent in DAPI staining (white arrow) and merged image with tubulin. Scale bar = 10 μm. (D) Effects of different combinations of therapeutic agents on gastric cancer cells. The schematic illustration shows how patient-derived samples can be used to screen for compounds and/or regimens that specifically tailored to specific cancers with different genetics and epigenetics.

