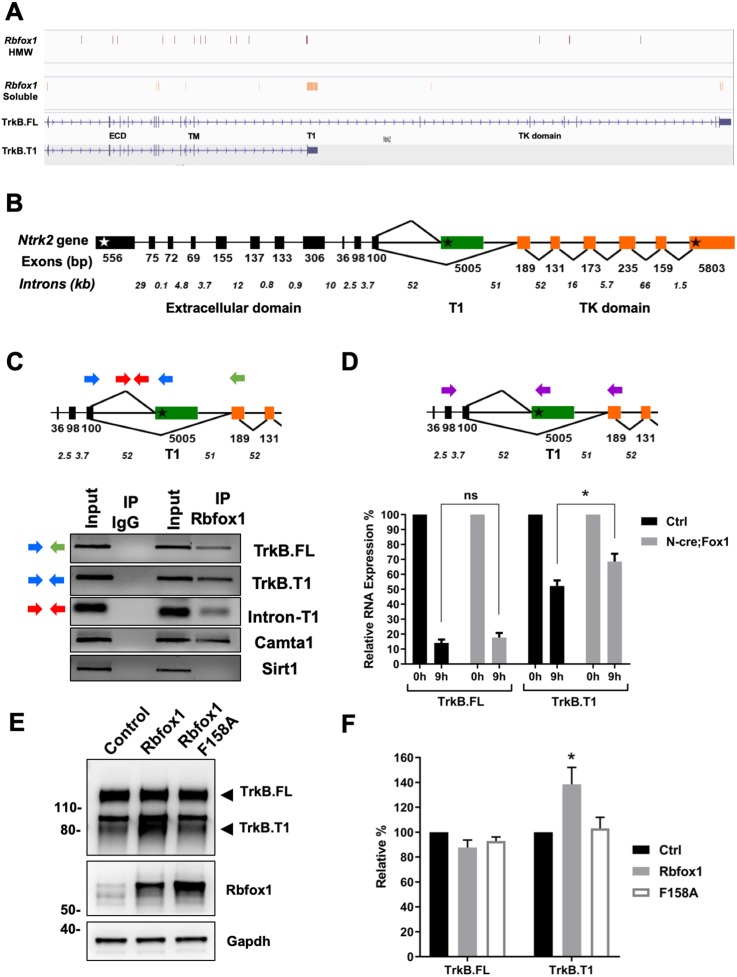
Figure 3. Rbfox1 upregulation increases mRNA stability of the TrkB.
T1-isoform and its RNA binding function is necessary to increase TrkB.T1 receptor levels. (A) Rbfox1 iCLIP analysis of mouse brain chromatin associated high molecular weight nuclear fraction (HMW) or soluble nuclear fraction (Soluble) (Damianov et al., 2016) showing association of Rbfox1 to TrkB transcripts in both HMW (vertical red bars) and soluble (vertical orange bars) nuclear fractions. Extracellular domain (ECD), specific TrkB.T1 region (T1) and tyrosine kinase domain (TK domain) are also indicated. (B) Schematic representation of the murine Ntrk2 gene. Exon lengths are indicated in base pairs (bp) while intron lengths are indicated as kilo-bases (kb). White and black stars indicate the start and stop codons respectively. (C) Agarose gels of RT-PCR amplification products from an RNA immunoprecipitation (RIP) analysis of wild type primary hippocampal neurons with an Rbfox1 antibody; input samples are from the PCR amplification of the RNA and antibody mixture before the immunoprecipition (IP) with mouse IgG or Rbfox1 antibodies. Indicated exonic (blue and green arrows) and intronic (red arrows) primers were used for the analysis. Note the presence of RT-PCR amplification bands following Rbfox1 IP for both TrkB.FL and TrkB.T1 and a proximal intronic region upstream of the specific TrkB.T1 exon, Camta1 (positive control; Gehman et al., 2011; Lee et al., 2016), but not Sirt1 (negative control). (D) Pulse-chase mRNA stability assay in primary hippocampal neurons derived from littermate control R26-Rbfox1+/flox (Ctrl) and Nes-Cre;R26-Rbfox1+/flox (N-cre;Fox1) embryos. Nascent RNA of primary neurons was labeled with 5-EU for 5 hr (pulsing) followed by QPCR analysis at 0 and 9 hr using c-DNA specific primers (purple arrows in schematic) for TrkB.FL and TrkB.T1. Values at 9 hr are expressed as percentage relative to 0 hr. n = 6 ± SEM; ns = p > 0.05; * = p ≤ 0.05 (Student’s t-test). (E); Rbfox1 RNA binding activity is required to promote TrkB.T1 up-regulation. Western blot analysis of wild-type mouse primary hippocampal neurons transfected with an adenovirus expressing WT Rbfox1 (Rbfox1) or an Rbfox1 with a mutation in the RNA binding domain (Rbfox1-F158A). Neurons were transfected after 4 days in vitro and analyzed 48 hr after transfection. (F) Quantification of TrkB.FL and TrkB.T1 protein from experiments as in E; n = 3 ± SEM. * = p ≤ 0.05, (Student’s t-test).


