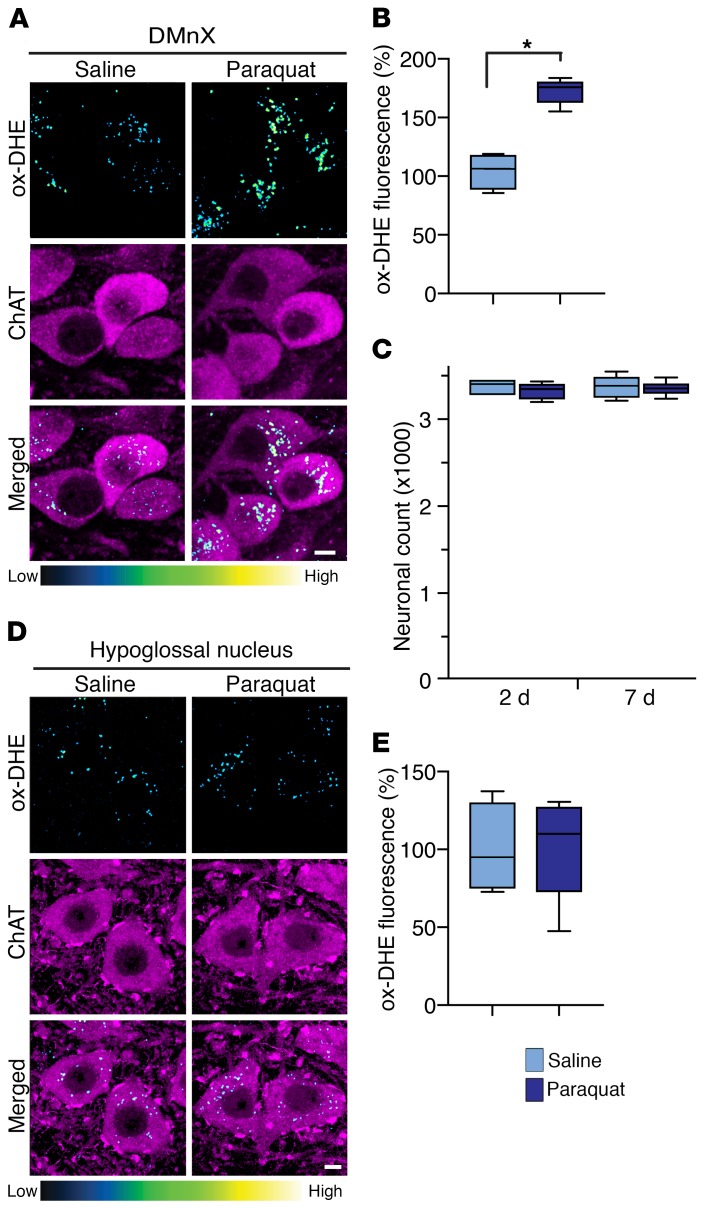
Figure 1. Paraquat-induced oxidative stress causes ROS accumulation in the DMnX, but not the hypoglossal nucleus.
(A) Mice received 2 i.p. injections of either saline or paraquat separated by a 1-week interval and were sacrificed at 2 days after treatment. They were also injected with DHE 1 hour before the time of sacrifice. Representative confocal images show fluorescent puncta of ox-DHE (a marker of ROS formation, blue-green-yellow color graded) within ChAT-immunoreactive neurons (magenta) in the DMnX. Scale bar: 5 μm. (B) Comparison of the integrated density of fluorescent ox-DHE puncta within ChAT-positive DMnX neurons from mice treated with saline (n = 4, light blue bar) or paraquat (n = 5, dark blue bar). Approximately 100 neurons/animal were analyzed and averaged. Values were calculated as percentage of the mean value in saline-injected animals. (C) Mice injected with saline (n = 4/time point) or paraquat (n = 4/time point) were sacrificed at 2 and 7 days after treatment, and the number of Nissl-stained neurons was counted unilaterally in the DMnX. (D) Representative confocal images show ChAT-positive hypoglossal neurons (magenta) containing fluorescent ox-DHE from mice injected with saline or paraquat and sacrificed 2 days after treatment. Scale bar: 5 μm. (E) Integrated density of ox-DHE puncta within ChAT-positive neurons in the hypoglossal nucleus. Analyses were carried out on tissue sections from mice treated with saline (n = 4) or paraquat (n = 5). Approximately 30 neurons/animal were analyzed and averaged. Values were calculated as percentage of the mean value in saline-injected animals. Box and whisker plots show median (middle line), upper and lower quartiles, and maximum and minimum as whiskers. *P ≤ 0.05, Mann-Whitney U test.

