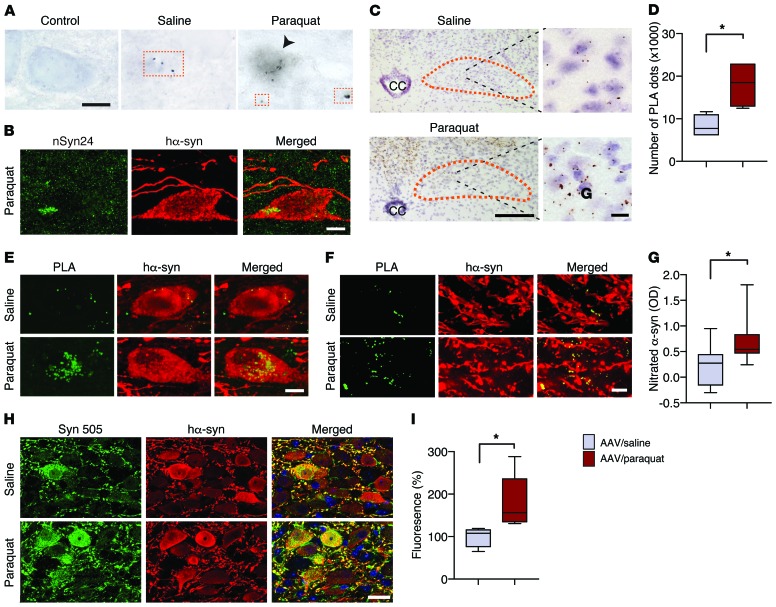
Figure 3. Severity of oxidative stress affects the degree of hα-synuclein oxidative modifications.
Mice received an infusion of hα-synuclein–carrying AAVs into the left vagus nerve and were injected i.p. with either saline or paraquat and sacrificed at 2 days after treatment. (A) Representative images show left DMnX tissue stained with anti-nitrated α-synuclein (nSyn24). Squares highlight neuritic immunoreactivity, while the arrowhead indicates a DMnX immunoreactive cell body. Scale bar: 10 μm. (B) Confocal images show a neuron immunoreactive for both nSyn24 and hα-synuclein in the left DMnX of a mouse treated with hα-synuclein AAVs/paraquat. Scale bar: 5 μm. (C) Representative low- and high-magnification images of the left DMnX (delineated in orange) show specific signal for nitrated hα-synuclein detected by indirect hα-synuclein/3-NT PLA. CC, central canal. Scale bars: 200 μm (left); 10 μm (right). (D) The number of PLA dots was counted in the left DMnX of mice treated with hα-synuclein AAVs/saline (n = 4, gray bar) or hα-synuclein AAVs/paraquat (n = 4, red bar). (E and F) Sections of the medulla oblongata were double labeled with PLA and anti–hα-synuclein. Representative images show cell bodies (E) and neurites (F) in the left DMnX. Scale bars: 5 μm. (G) Nitrated α-synuclein was measured in the dorsal left medulla oblongata by ELISA. OD was compared in samples from mice treated with hα-synuclein AAVs/saline (n = 9) versus hα-synuclein AAVs/paraquat (n = 9). (H and I) Medullary sections were double stained with Syn 505 and anti–hα-synuclein. (H) Representative confocal images show left DMnX tissue. Scale bar: 10 μm. (I) Fluorescence densities for Syn 505 and hα-synuclein were measured on images of the left DMnX of mice treated with hα-synuclein AAVs/saline (n = 4) or hα-synuclein AAVs/paraquat (n = 5). At least 6 images/animal were analyzed. Values were calculated as the ratio of Syn 505/hα-synuclein fluorescence and are expressed as percentage of the mean value in hα-synuclein AAV/saline–injected animals. Box and whisker plots are shown. *P ≤ 0.05, Mann-Whitney U test.

