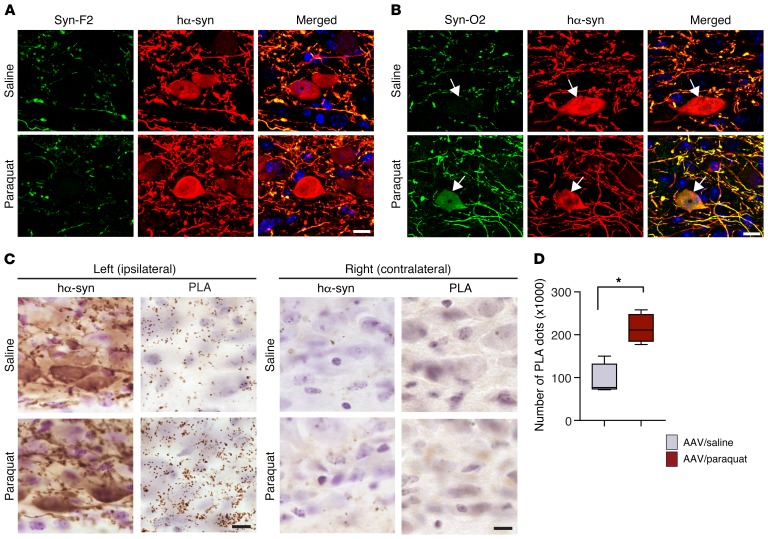
Figure 4. Severity of oxidative stress affects the extent of α-synuclein aggregation.
Mice received an injection of hα-synuclein–carrying AAVs into the left vagus nerve and were injected systemically with either saline or paraquat and sacrificed at 2 days after treatment. (A) Representative confocal images show left DMnX tissue double labeled with an antibody that recognizes only mature α-synuclein fibrils (Syn-F2) and with anti–hα-synuclein. Scale bar: 5 μm. (B) Representative confocal images of left DMnX tissue. One of the antibodies used for double staining detects oligomeric and fibrillar forms of α-synuclein (Syn-O2). The other antibody was anti–hα-synuclein. Arrows indicate 2 hα-synuclein–positive neurons, one from a mouse injected with saline and the other from an animal treated with paraquat; the latter is also Syn-O2 immunoreactive. Scale bar: 5 μm. (C) Sections of the medulla oblongata were labeled with anti–hα-synuclein or with syn/syn PLA, which detects aggregated (preferentially oligomeric) hα-synuclein. Protein overexpression and aggregation were visualized in the left (ipsilateral to AAV infusion) and right (contralateral) DMnX and compared in mice treated with hα-synuclein AAVs/saline versus hα-synuclein AAVs/paraquat. Scale bars: 10 μm. (D) The number of syn/syn PLA dots was counted stereologically in the left DMnX from mice treated with hα-synuclein AAVs/saline (n = 4, gray bar) or with hα-synuclein AAVs/paraquat (n = 4, red bar). Box and whisker plots show median, upper and lower quartiles, and maximum and minimum as whiskers. *P ≤ 0.05, Mann-Whitney U test.

