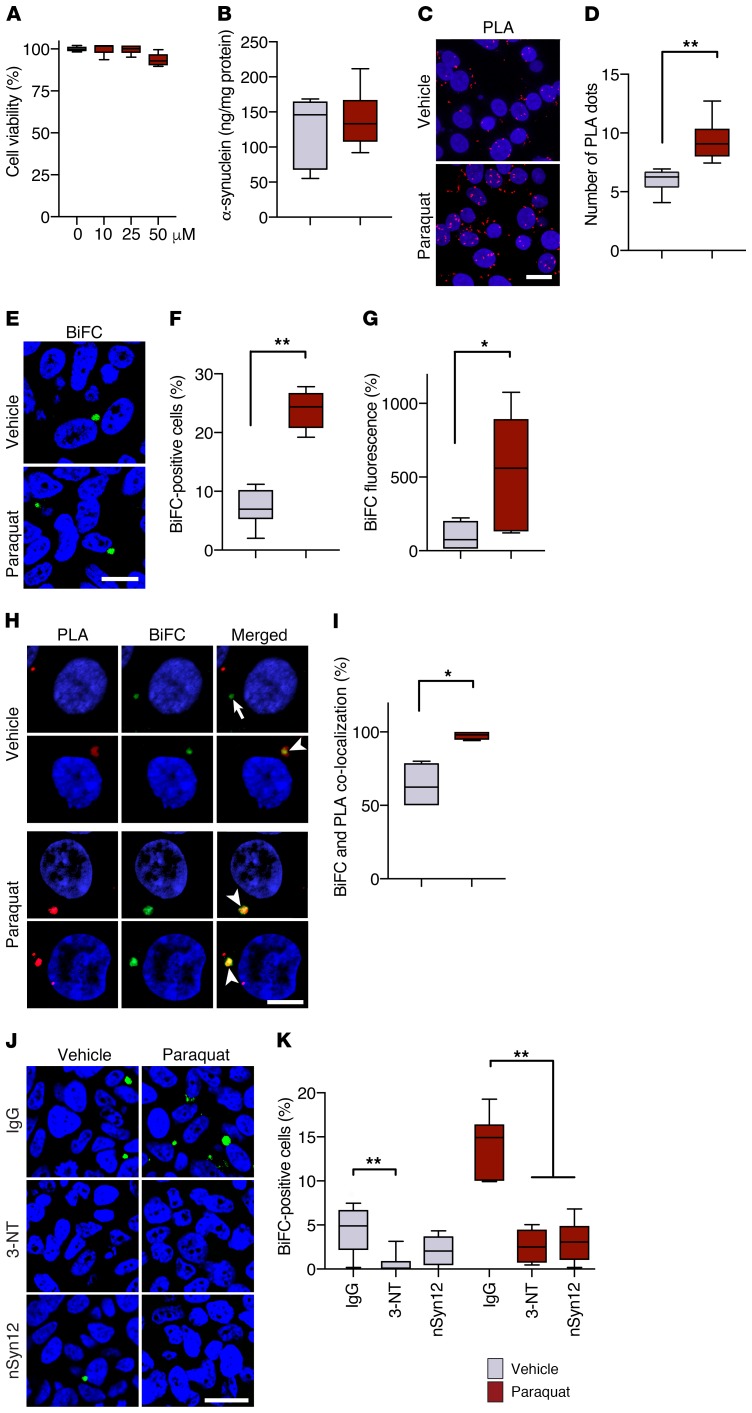
Figure 8. Cell-to-cell hα-synuclein exchange is promoted by oxidative stress in vitro.
(A) Cocultures of V1S- and SV2-expressing cells were incubated for 2 days with vehicle (n = 6 separate experiments, gray bar) or different concentrations of paraquat (n = 6/concentration, red bars). Cell viability was measured and expressed as percentage of vehicle-treated cultures. (B) Levels of hα-synuclein were measured in cocultures treated with vehicle (n = 6) or 25 μM paraquat (n = 6) by ELISA. (C and D) Representative images show accumulation of nitrated hα-synuclein in the form of hα-synuclein/3-NT PLA dots (red). Cell nuclei were stained with DAPI (blue). Scale bar: 10 μm. The number of PLA dots was counted in cultures treated with vehicle (n = 4) or paraquat (n = 4). A minimum of 100 cells/experiment were analyzed. PLA counts were divided by the number of cells, and values were averaged. (E) Representative images show BiFC (green) as a marker of hα-synuclein transfer into recipient cells. Scale bar: 20 μm. (F and G) The percentage of BiFC-positive cells (n = 6/treatment, F) and cell fluorescence intensity (n = 6/treatment, G) were compared in cultures treated with vehicle or paraquat. Integrated density of BiFC fluorescence was measured in a minimum of 400 cells/experiment and expressed as percentage of the mean value in vehicle-treated cultures. (H and I) Representative images show hα-synuclein/3-NT PLA (red) and BiFC (green) fluorescence. The arrow indicates lack of signal colocalization, while the arrowheads show colocalization. Scale bar: 5 μm. The percentage of BiFC aggregates colocalizing with PLA was calculated in cultures treated with vehicle (n = 4) or paraquat (n = 4). Minimum 100 cells/experiment. (J and K) Representative images show BiFC (green) in cocultures treated with saline or paraquat in the presence of IgG, anti–3-NT, or anti-nitrated α-synuclein (nSyn12). Scale bar: 20 μm. The percentage of BiFC-positive cells (n = 6/treatment) was calculated under different treatment conditions. *P ≤ 0.05; **P ≤ 0.01, Mann-Whitney U test or Kruskal-Wallis followed by Dunn’s post hoc test (K).

