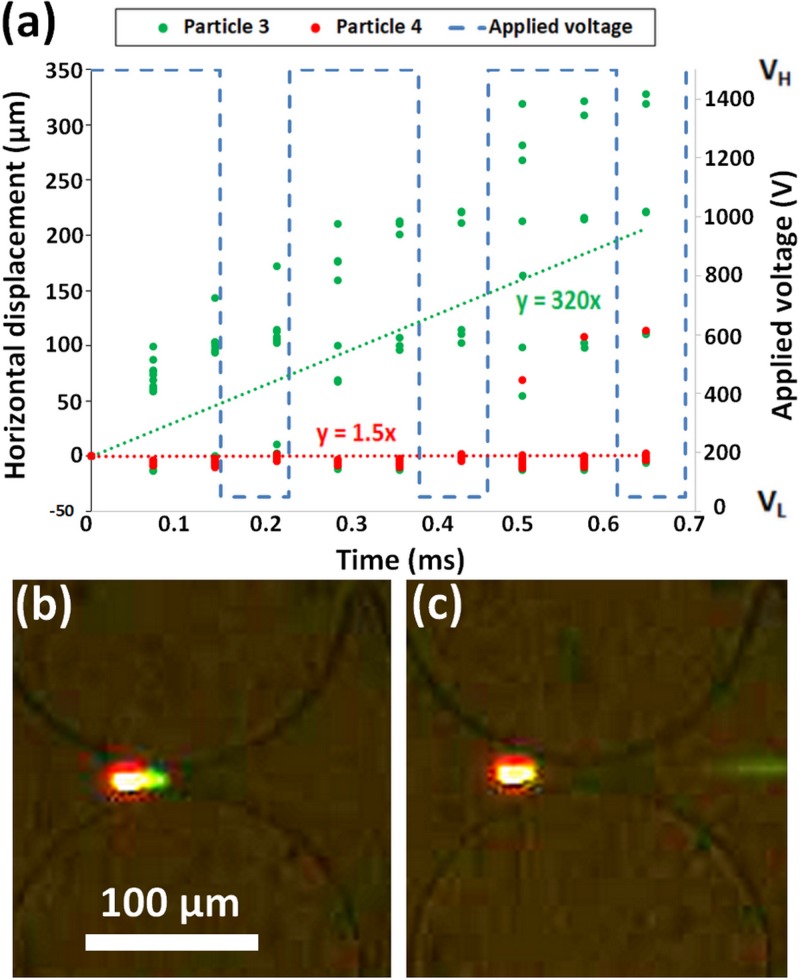
FIG. 5.
Separation of particles 3 (2 μm, green) and 4 (5 μm, red) from Table I using custom signal. (a) Plot of tracked particle positions, particle 3 shown in green and particle 4 shown in red. Custom signal shown with dashed blue line. (b) Image of both particles trapped during the application of VH (1500 V). (c) Image of particle 3 on the right side of constriction and particle 4 on the left side of constriction resulting in particle separation.

