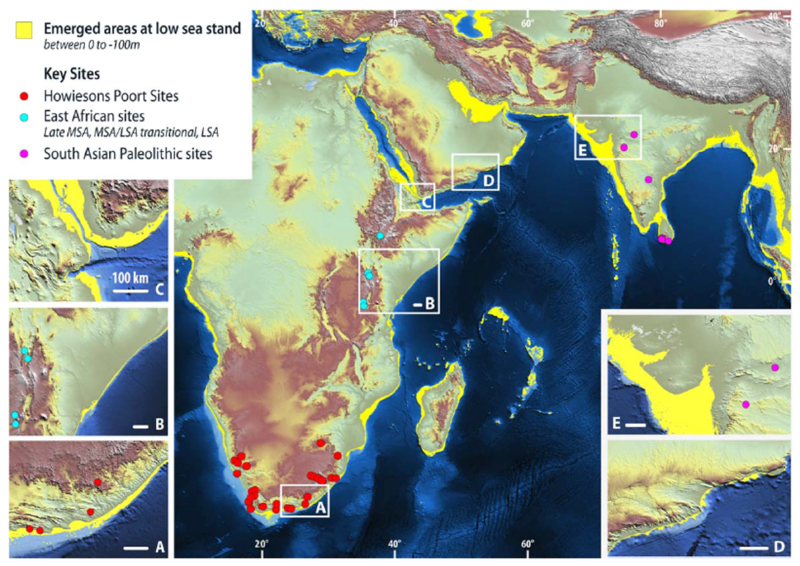
Figure 3.
Map showing topography and bathymetry (SRTM30PLUS). Areas in yellow correspond to currently submerged land that would have been exposed when sea level was ~100m lower than present. Colored dots correspond to key archaeological sites (Howiesons Poort, MSA/LSA transitional and South Asian Late Paleolithic) emphasized by the Mellars et al. model.17 The inserts show that the landscape can be very different from place to place and that there is no ‘typical’ coastal environment.

