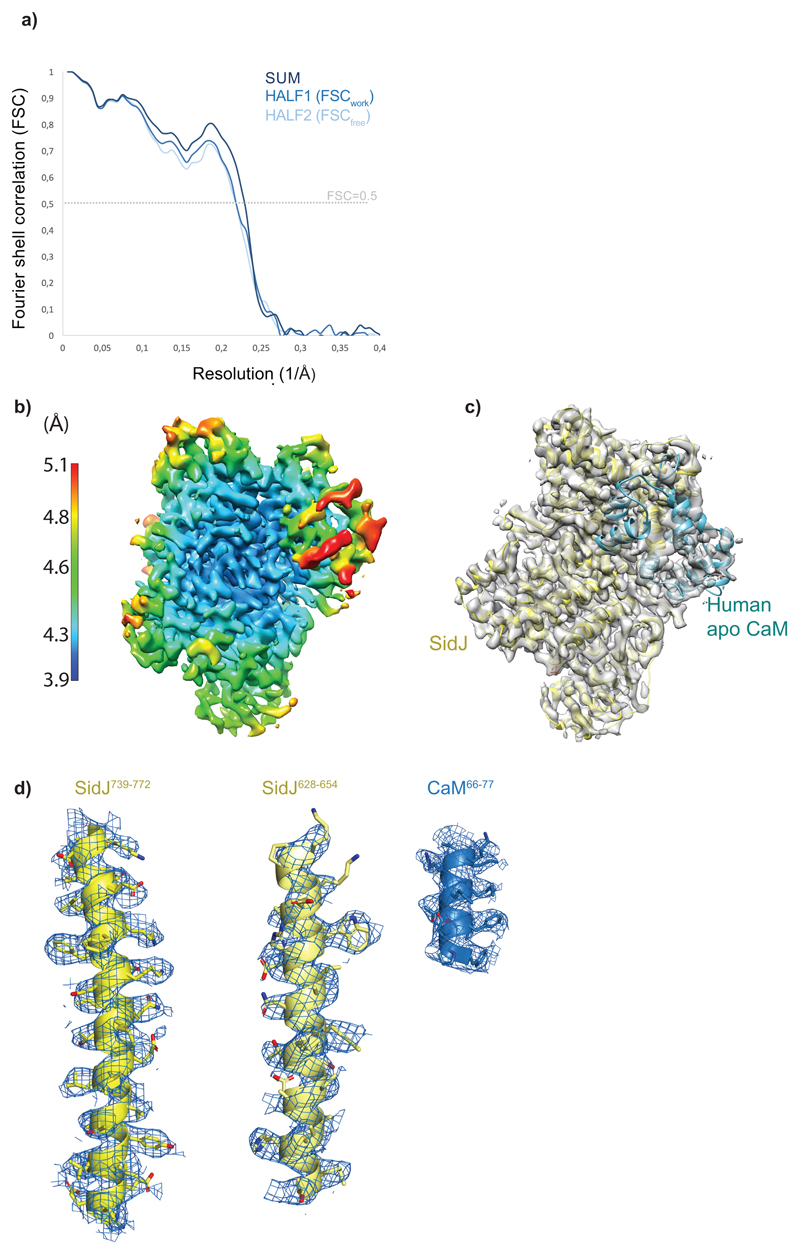
Extended data Fig. 8. Cryo-EM model refinement.
a) FSC between model and the map and cross-validation of the model fitting. FSC0.5 = 4.3 Å for the model vs map (sum). Half-map cross validation procedure22 does not show significant overfitting in the refined model. b) Local resolution analysis (Relion) shows variation in the map resolution ranging from 3.9 to 5.1 Å. c) Overview of the model fitting into the map in the same orientation as in b. d) An example of the cryo-EM map quality with the atomic model fitted in, showing clear density for side chains.

