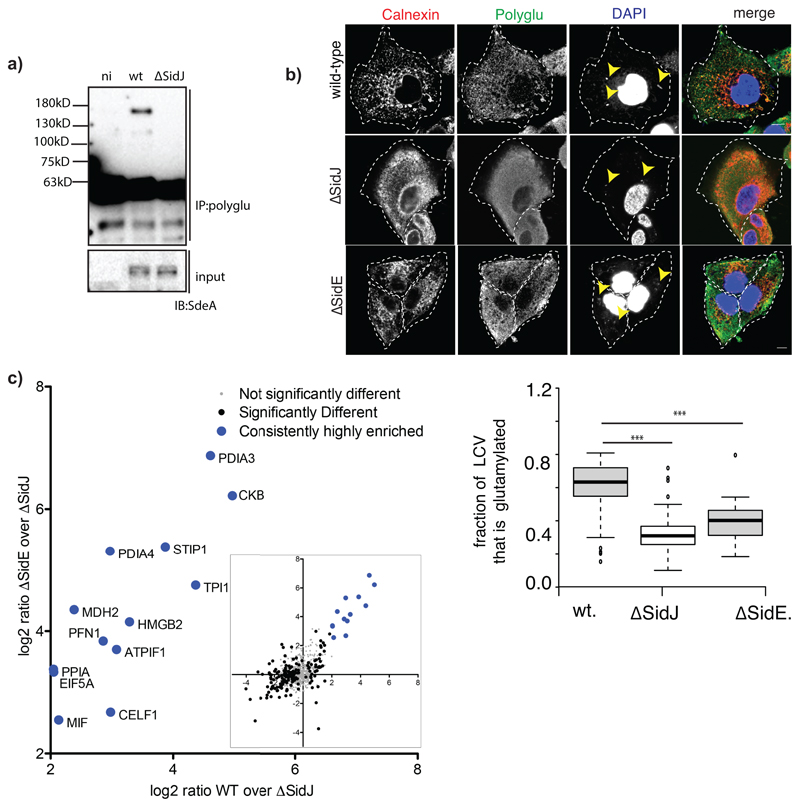
Extended data Fig. 10. SidJ-dependent glutamylation during Legionella infection.
a) Raw264.7 macrophages were infected with WT, ΔSidJ or ΔSidE Legionella for 3h. Lysates were used for immunoprecipitation with polyglutamylation antibody followed by immunoblotting with SdeA. n.i indicates samples that were not infected with bacteria. This experiment was repeated twice independently with similar results. b) A549 cells were infected with different strains of Legionella pneumophila for 3h. Cells were fixed and immunostained with antibodies against calnexin and poly-glutamylation (GT335). DAPI staining marks the nucleus and cytosolic bacteria. Yellow arrows indicate bacteria in infected cells. Region of interest (ROI) is defined as Calnexin stained LCV. 80x100 um2 ROIs were chosen in the perinuclear region of cells followed by quantification of Mander’s coefficient (m) using Coloc2 plugin in FIJI. m represents the fraction of calnexin-positive LCVs that are also positive for poly-glutamylation. Center lines show the medians; box limits indicate the 25th and 75th percentiles as determined by R software; whiskers extend 1.5 times the interquartile range from the 25th and 75th percentiles, outliers are represented by dots. Number of ROIs (n) = 80 from 30 cells was used for quantification. *** indicates p<0.001 by 2-tailed type 3, Students t-test. p-value (WT vs ΔsidJ) =6.18x 10⁻²⁹, p value (WT vs ΔsidE) = 1.09x 10⁻⁵. This experiment was repeated twice independently with similar results. c) Glutamylated proteins were isolated from WT, ΔsidE and ΔsidJ Legionella infection experiments using GT335 antibody and quantified using mass spectrometry. Correlation between WT vs ΔsidJ and ΔsidE vs. ΔsidJ quantifications are plotted (inset) showing the most correlated proteins in the abovementioned two quantifications. Legionella infection and label-free LC-MS analysis was performed with n=3 biologically independent experiments. Significant differences between samples were detected by a permutation based FDR 0.05 corrected two-sided Student's t-test. Proteins were labelled as significant, if they were above the FDR 0.05 threshold in at least one comparison (ΔsidE and WT Legionella compared to ΔsidJ infected cells). Proteins with a Log2 ratio above 2 (mean) in WT samples were labelled as highly enriched compared to ΔsidJ infected cells in samples from WT and well as ΔsidE infected cells.

