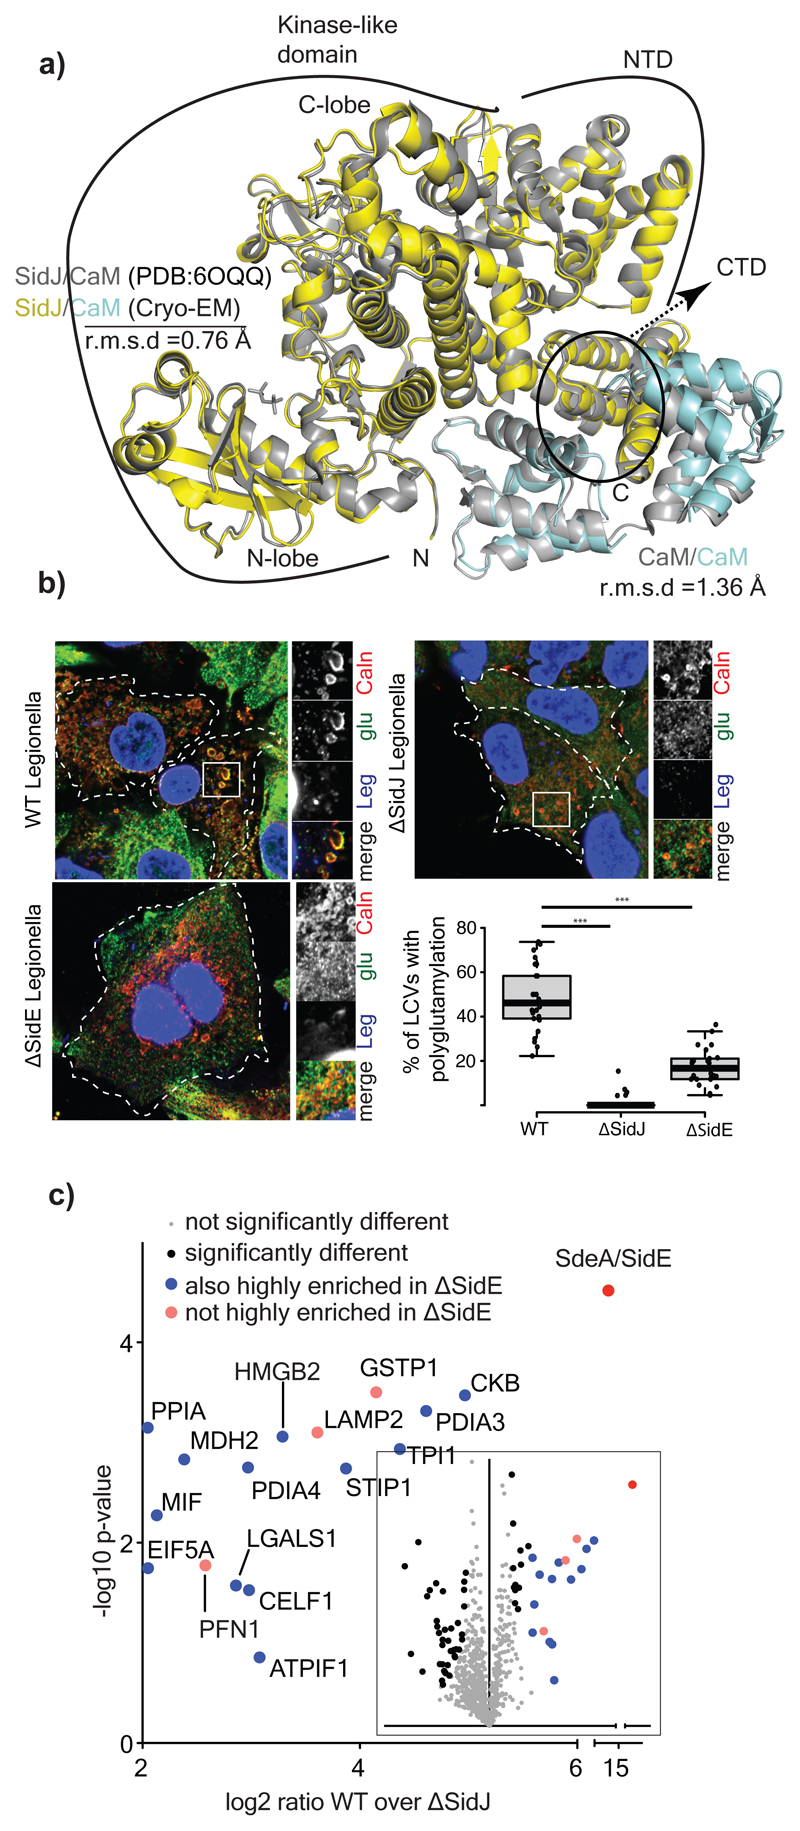
Figure 4. Glutamylation of SidEs and host proteins during Legionella infection.
a) Comparison of the crystal structure of SidJ/Yeast CaM (PDB:6OQQ) with the Cryo-EM structure showing r.m.s.d values of various regions marked accordingly. b) A549 cells were infected with different strains of Legionella pneumophila for 3h. Cells were fixed and immunostained with antibodies against calnexin (Caln) and polyglutamylation (Glu). DAPI staining marks the nucleus and cytosolic bacteria (Leg). Number of LCVs (marked by calnexin) that are positive for poly-glutamylation are counted in FIJI, % of polyglutamylated LCVs is plotted for cells infected with different strains of Legionella. Data represents 100 LCVs taken from 30 cells over n=3 biologically independent experiments. Error bars indicate standard deviation. *** indicates p<0.001 using 2 tailed, type-3 Student's t-test. p value= 8.45x 10^-15 (WT vs ΔsidJ); p value =5.14X10^-11 (WT vs ΔsidE). c) Glutamylated proteins were isolated from WT and ΔsidJ Legionella infection experiments using GT335 antibody and quantified using mass spectrometry. Data is represented in volcano plot (inset) showing the most enriched proteins in WT. n=3 biologically independent experiments. Significant differences between samples were detected by a permutation based FDR 0.05 corrected two-sided Student's t-test. Proteins with Log2 ratio above 2 (mean) were labelled as highly enriched in WT compared to ΔsidJ infected cells. For gel source data, see Supplementary Fig. 1.

