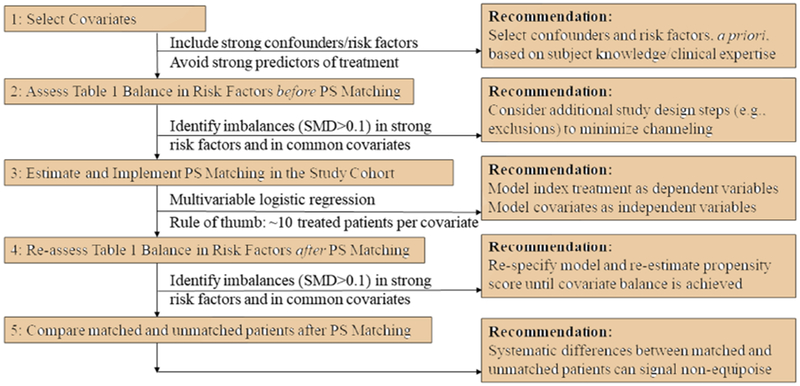
FIGURE 2. Checklist for Implementing and Diagnosing Propensity Score (PS) Methods.

Note: the standardized mean difference (SMD) is calculated as the difference between two means or proportions, divided by the pooled standard deviation. The SMD is advantageous over the p-value in that it quantifies the degree of imbalance and is not sensitive to sample size.
