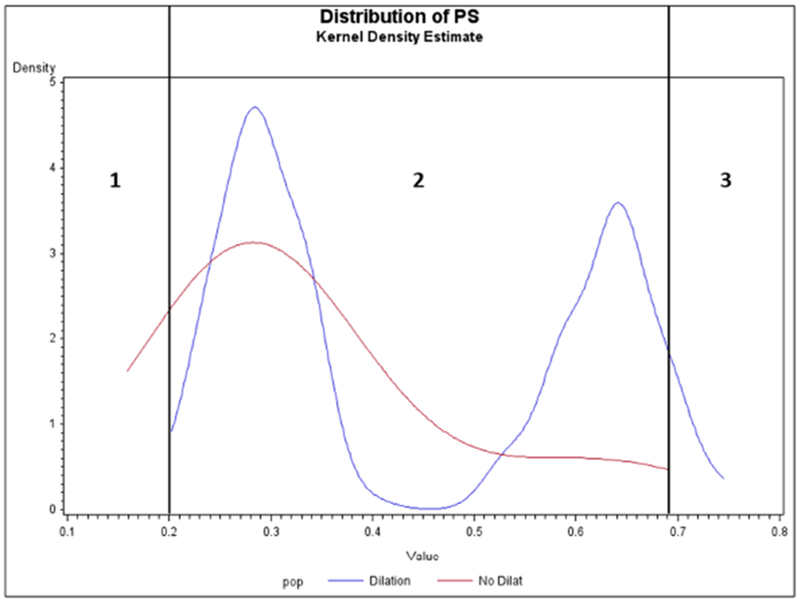
FIGURE 3. Distributions of estimated propensity scores (PS) for patients treated with balloon dilation versus nondilation.

This figure presents the distribution of estimated propensity scores among a study cohort of 411 adults with newly diagnosed eosinophilic esophagitis, 156 of whom received esophageal dilation (blue line) and 255 of whom did not (red line). The propensity score represents each patient’s predicted probability, or propensity, of being dilated, given his or her measured baseline characteristics and comorbidities.
