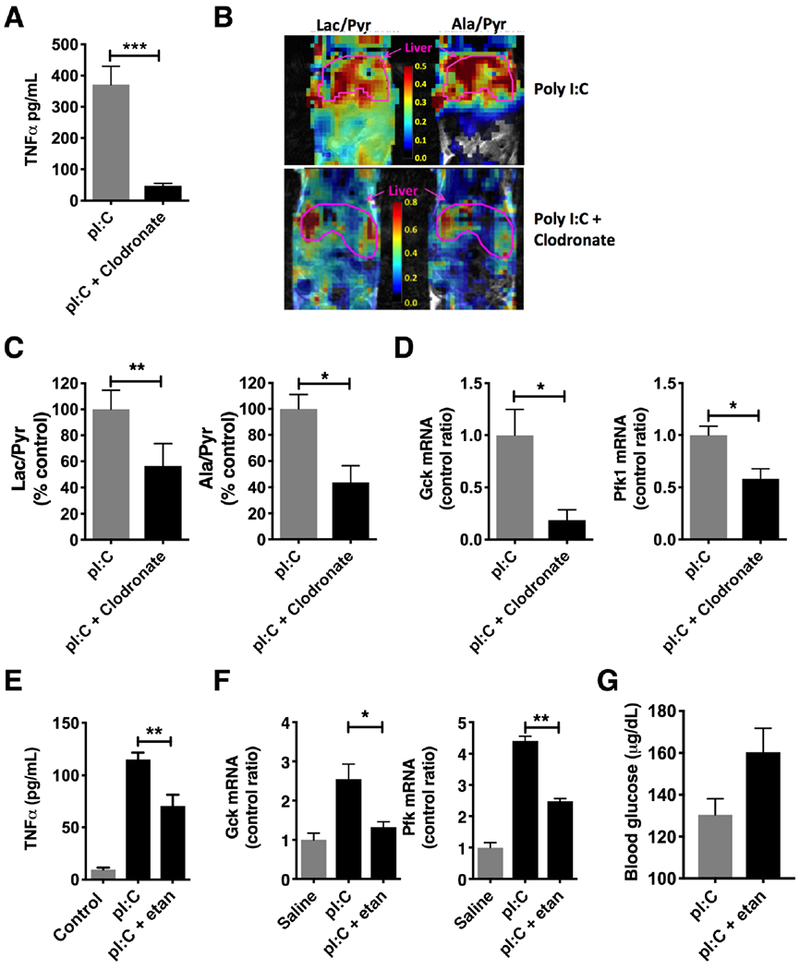
Figure 5: In vivo targeting of the immune metabolic axis results in depressed glycolysis.

Mice injected with pI:C for 3 days were pretreated by intraperitoneal injection with liposomal clodronate or etanercept, a TNFα antagonist. A) Serum TNFα in clodronate treated mice (N = 5/group). B) MR spectroscopic map of lactate/pyruvate ratios and alanine/pyruvate ratios following injection with hyperpolarized 13C-pyruvate in clodronate treated mice. C) Summary data of lactate/pyruvate (left) and alanine/pyruvate (right) ratios following clodronate treatment in mice (N = 3-4/group). D) qPCR for glucokinase (Gck, left) and phosphofructokinase (Pfk, right) in livers from clodronate-treated mice (N = 3-4/group). E) Serum TNFα during treatment with etanercept (N = 5/group). F) qPCR for glucokinase (Gck, left) and phosphofructokinase (Pfk, right) in livers from etanercept-treated mice (N = 3/group). G) Blood glucose during etanercept treatment (N = 5 / group), etan = etanercept. * P < 0.05, ** P < 0.01, *** P < 0.001. Error bars = standard error of the mean.
