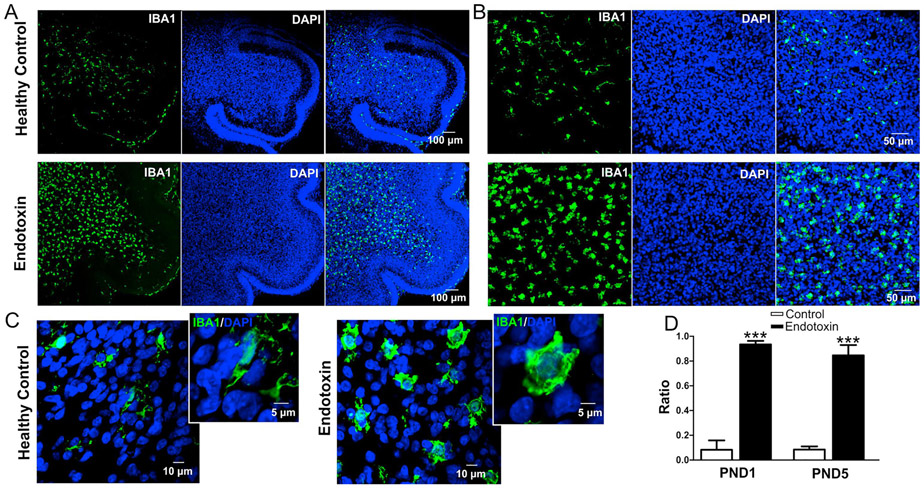
Figure 1.
Microglial activation in endotoxin group kits compared with age-matched healthy controls. A-C, Representative images of microglial distribution and morphology in cerebellar white matter in healthy control and endotoxin kits at PND1 (A), 20x magnification (B), and 63x magnification (C). D, The ratio of activated to total microglia in healthy control and endotoxin kits at PND1 and PND5. ***p<0.001.

