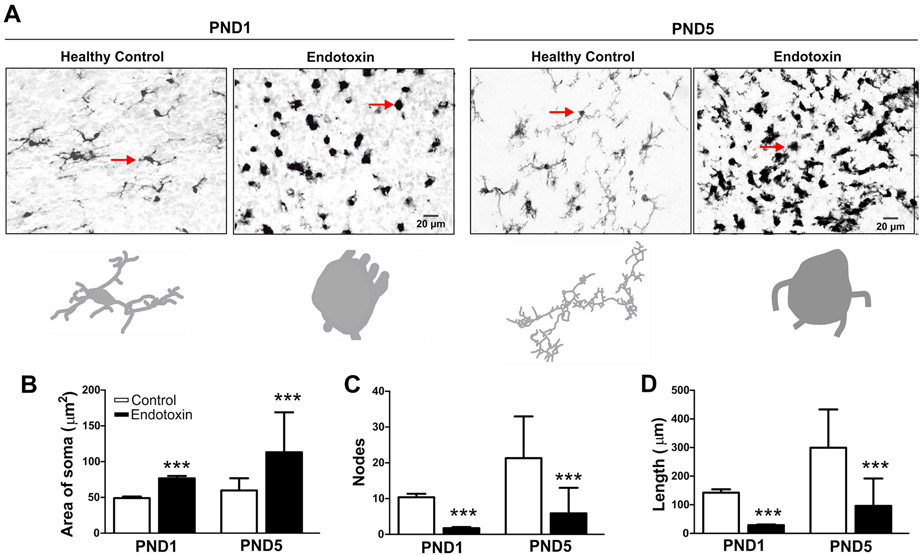
Figure 2.
Microglial morphology in healthy controls and endotoxin kits. Brain slices were stained with IBA1 antibody (microglial marker) and images (40x) were randomly acquired from the white matter areas from healthy controls and endotoxin kits. A, Representative images of microglia in healthy control and endotoxin kits at PND1 and PND5. The arrows indicate the microglia that corresponding to the Neurolucida tracing images. B-D, Microglial morphological analysis. The microglia in the endotoxin kits had significantly increased area of the soma (B), significant decreased node (C) and length (D) of the processes, compared to the healthy control kits at PND1 and PND5. ***p<0.001.

