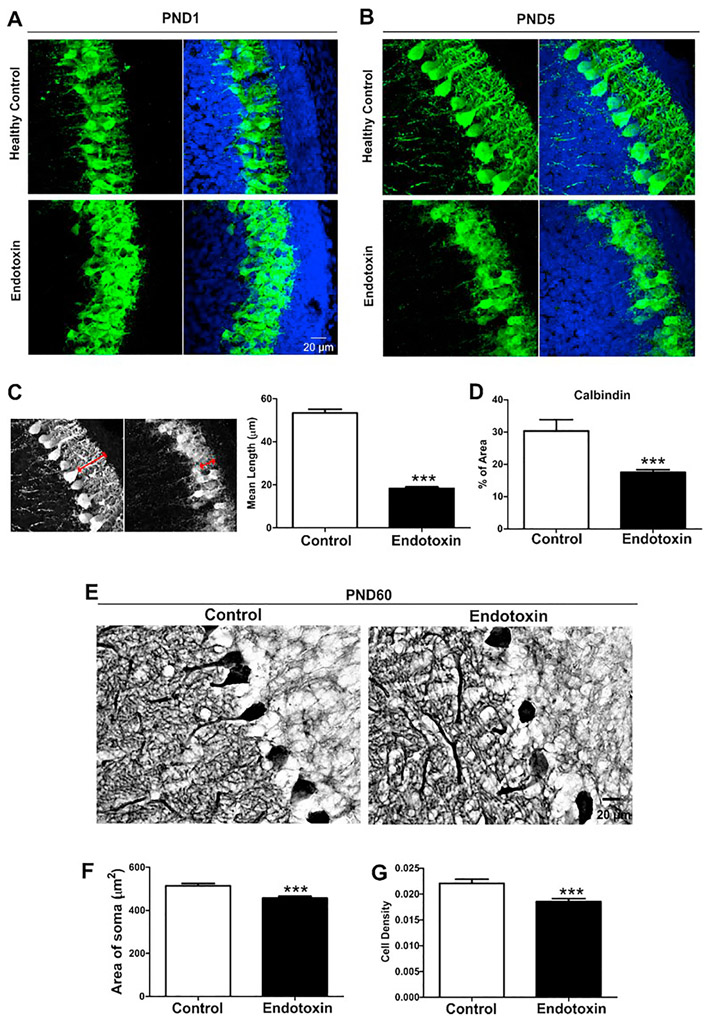
Figure 4.
Purkinje cell morphology. A, B, Representative confocal images of Purkinje cells in control and endotoxin kits at PND1 (A) and PND5 (B). Purkinje cells had less dendritic structures in endotoxin kits. C. The mean maximal dendritic length was significantly decreased in endotoxin kits at PND5, compared with healthy controls. D. The percentage of calbindin staining significantly decreased in endotoxin kits when compared with healthy controls. E. Representative images of Purkinje cells in control and endotoxin kits at PND60. F. The size of the soma of Purkinje cells in endotoxin kits was significantly smaller than controls. G. The cell density of Purkinje cells in endotoxin kits significantly decreased, compared with controls. ***p<0.001

