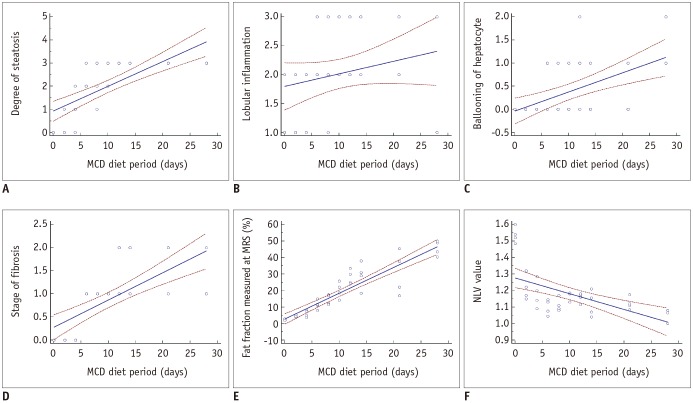
Fig. 2. Induction of nonalcoholic fatty liver disease in rats with MCD diet.
Line graphs with trend lines (blue solid lines) and their 95% confidence intervals (red dashed lines). Graph shows changes in histopathologic findings (A–D), measured fat fraction at MRS (E), and NLV value on ultrasonography (F) according to duration of MCD diet.

