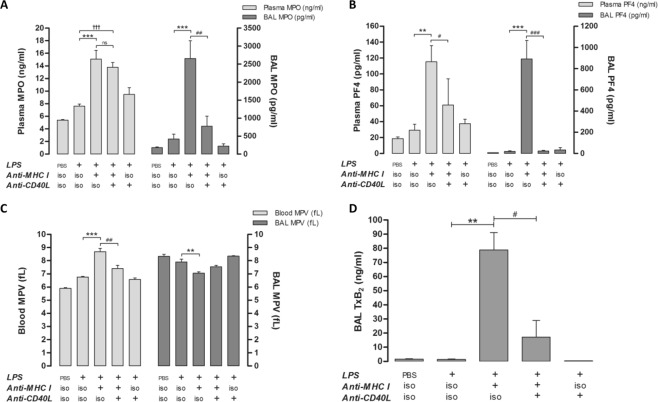
Figure 3.
Evaluation of neutrophil and platelet activation. Quantification of MPO (A - n = 10) and PF4 (B - n = 10) in both plasma and BAL. MPV, in whole blood and BAL (C - n = 10), was determined by MS4® analysis for each group of mice. TxB2 in BAL (D - n = 10) was evaluated by ELISA for each group of mice. Data are presented as means ± SEM (n = 10). *p < 0.05, **p < 0.01, and ***p < 0.001 indicate differences between the [LPS] and [LPS + anti-MHC I] groups; †p < 0.05, ††p < 0.01, and †††p < 0.001 indicate differences between the [LPS] and [LPS + anti-MHC I + anti-CD40L] groups; and #p < 0.05, ##p < 0.01, and ###p < 0.001 indicate differences between the [LPS + anti-MHC I] and [LPS + anti-MHC I + anti-CD40L] groups.

