Fig. 1.
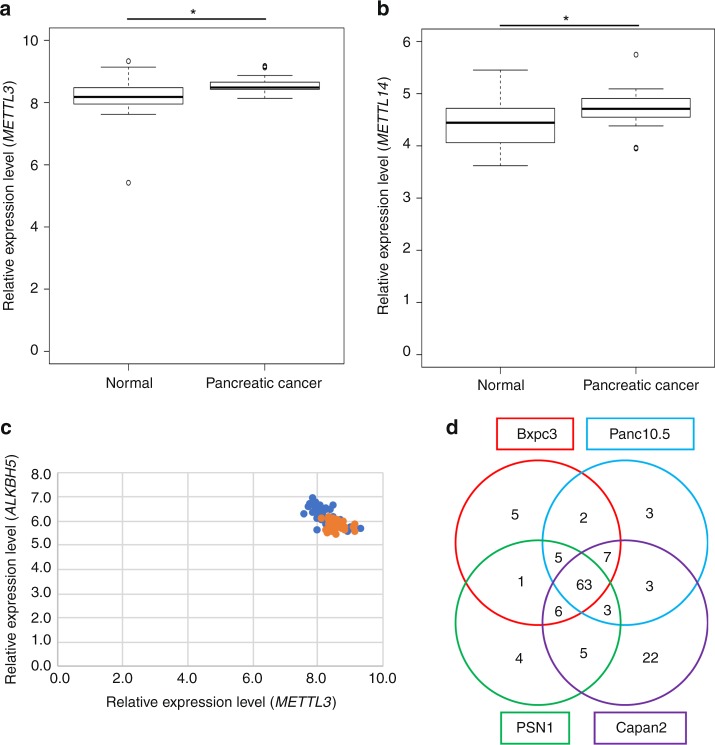
Methylated miRNAs are tended to upregulated in gastrointestinal cancer. a Analysis of RNA expression levels of the RNA methylases METTL3 using a Gene Expression Omnibus (GEO) dataset (GDS4103) derived from pancreatic cancer and paired normal tissue samples from 36 patients. *p= 7.68 × 10⁻⁵ (Wilcoxon’s t test). b Analysis of RNA expression levels of the RNA methylase METTL14 using a Gene Expression Omnibus (GEO) dataset (GDS4103) derived from pancreatic cancer and paired normal tissue samples from 36 patients. *p= 0.007193 (Wilcoxon’s t test). c Analysis of the correlation between METTL3 and ALKBH5 expression levels. Blue and orange points represent normal tissue and Pancreatic cancer tissue, respectively. R value was −0.68 in normal tissue and −0.19 in pancreatic cancer. d Methylated miRNA analysis by RIP-Seq using an anti-m6A antibody. The Venn diagram shows that 63 methylated miRNAs were common to four pancreatic cancer cell lines. The box range means from the first quartile to the third quartile. The second quartile means the median of the data. The lower limit of the bar was estimated by “the first quartile − 1.5 × interquartile range”, and the upper limit of the bar was estimated by “the third quartile + 1.5 × interquartile range”

