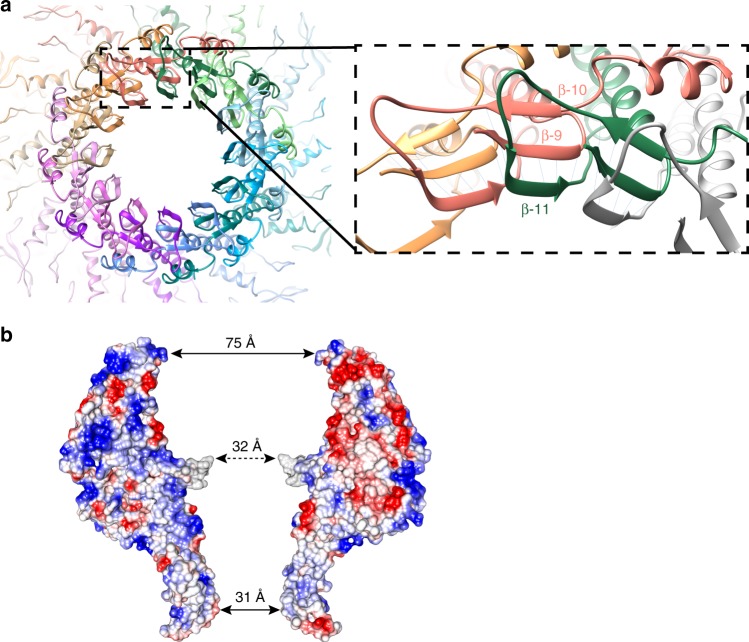
Fig. 2.
Protein–protein interactions in the EBV portal oligomer. a Axial view of EBV portal protein at the β-tunnel region (left), and a close-up view of protomer–protomer β-sheet formation (right) with β-strands 9, 10 of one protomer and 11, from an adjacent protomer. b Electrostatic potential of two opposing monomers within EBV portal dodecamer. Blue represents 10 kcal/(mol · e) positive potential, while red represents −10 kcal/(mol · e) negative potential. Indication of the distance between residues in the central part of the channel at different levels is included. Gray shows the six residues of the tunnel loop with weak density

