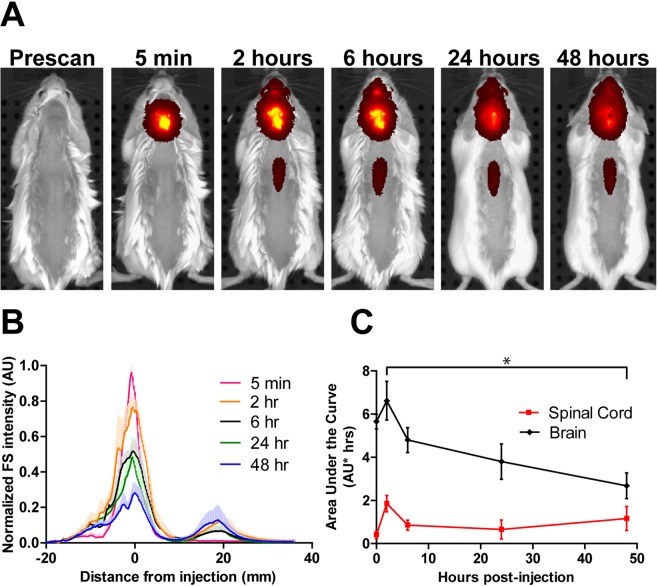
Figure 1.
Semi-quantitative IVIS tracking of FNP distribution after IT administration in intact healthy mice. FNPs can be observed with semi-quantitative measurement over the brain and spinal cord. (A) Representative images show the spread of FNPs away from the cisterna magna over time. FNPs were detectable along the spinal cord by 2 hours but only along the mid of the back unobstructed by the extra muscle of the forelimbs and hindlimbs. (B) A graph of FNP intensity along a line profile from nose to tail demonstrates a relative decrease in total signal along the dorsal brain with a slight increase in signal along the dorsal spine over time. (C) AUCs calculated from the brain signal (−20 to 10 mm) and spinal signal (10 to 40 mm) showed significant clearance of FNPs from the brain region from 2 to 48 hours (p < 0.05, 1-way ANOVA with Tukey’s multiple comparison test), while the FNP intensity along the spinal cord did not significantly change over the 48 hours. Mean + SD shown in B to help keep lines visible. AUC points show mean ± SD.

