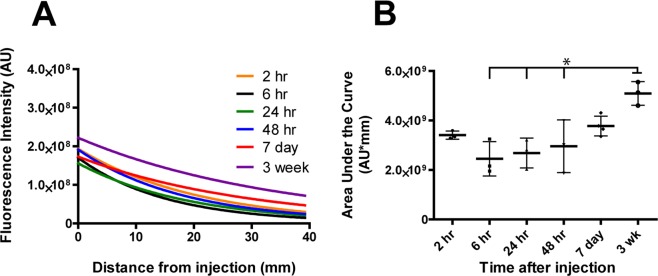
Figure 4.
Quantification of FNP intensity along the spinal column following IT injection. (A) Exponential curve fits of FNP intensity along the spinal column showed relatively constant decay in FNP signal moving caudally down the spinal cord at all time points. (B) AUC of the curve fits for individual mice at each time point (n = 3/time point) shows FNP delivery to the spinal cord trended upwards over time and was significantly higher at 3 weeks compared to 6, 24 and 48 hours (p < 0.05, 1-way ANOVA with Bonferroni’s Multiple Comparison Test). Mean ± SD shown.

