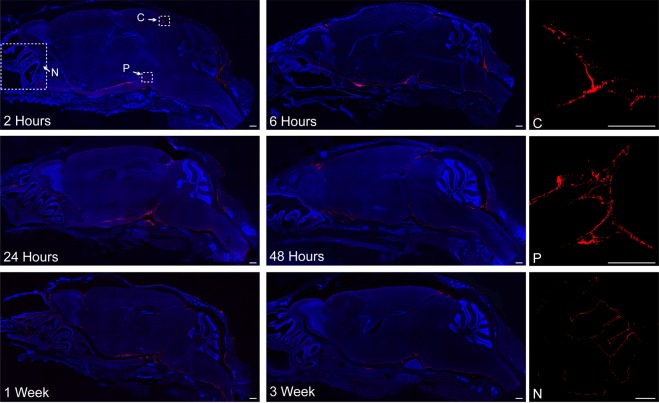
Figure 5.
Representative confocal images of FNP distribution around the brain. FNPs (red) were distributed around the entire brain and could be seen following the meninges into the sulci of the cerebellum. There was a strong preference for ventral distribution and consistently high delivery to the supracerebellar cistern (C) and pituitary recess (P). Clearance of FNPs across the cribriform plate into the nasal mucosa (N) was seen at all time points. Qualitatively, a general decrease in total FNP intensity was observed over time, consistent with IVIS data. Linear corrections were applied equally across images to better show FNP distribution. Cell nuclei (DAPI) are in blue to show the gross anatomy of the brain. Images without DAPI, to better see FNP signal, can be found in the Supplementary data. Scale bar = 500 µm.

