Figure 7.

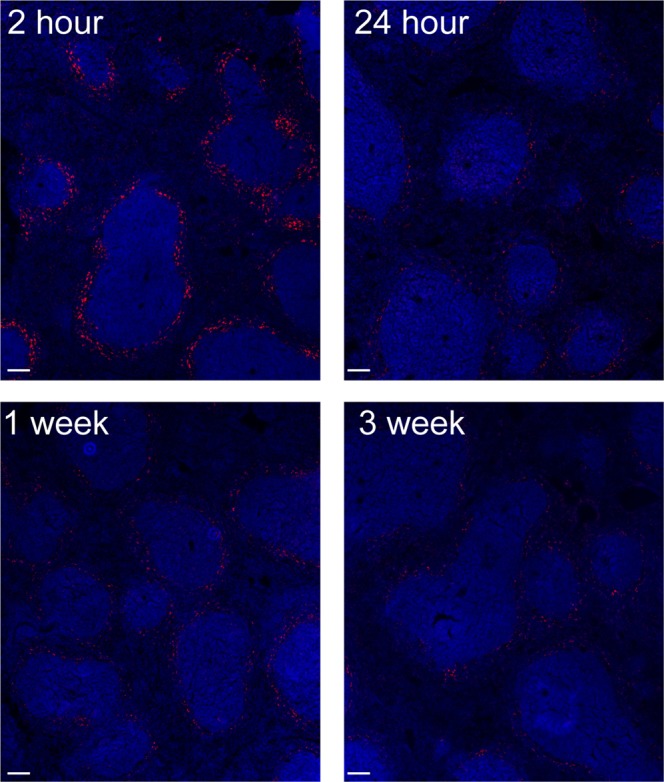
Representative confocal image of FNP distribution to the spleen over time. FNPs (red) appeared to be localized around the white pulp, with the greatest signal observed at 2 hours. Cell nuclei (DAPI) shown in blue. Scale bar = 100 µm.

Representative confocal image of FNP distribution to the spleen over time. FNPs (red) appeared to be localized around the white pulp, with the greatest signal observed at 2 hours. Cell nuclei (DAPI) shown in blue. Scale bar = 100 µm.