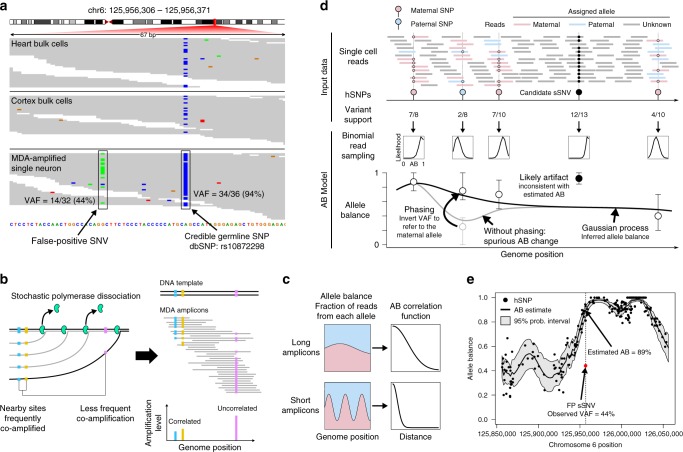
Fig. 2.
The allele balance model helps to identify single cell artifacts. a A single cell artifact (left, green) attains high VAF (44%). The region is affected by allelic imbalance as evidenced by the hSNP with VAF 94% (right, blue). The candidate sSNV should present with VAF ≈ 6% or VAF ≈ 94%. b MDA polymerase (green) randomly dissociates from the template DNA belonging to one allele (black), creating amplicons (gray) of various lengths. Nearby sites are highly likely to be amplified by the same polymerase, but the probability decreases for more distant sites. This creates a correlation in allele-specific amplification levels between nearby sites (blue, orange). The process occurs independently on both homologous alleles, leading to a stable allele balance in a small genomic locus. c Long amplicons cause allele-specific read depths (blue, paternal allele; pink, maternal allele) to change more slowly along the genome. When each allele is more stable, so is the allelic balance. The AB correlation function quantifies allele balance stability. d Illustration of AB modeling and estimation. Reads at hSNPs can be assigned to alleles based on whether they contain reference- or variant-supporting bases. This allows allele-specific depth, and therefore AB, to be estimated at the hSNP. AB outside of hSNP loci is inferred (thick black line) using a Gaussian process parameterized by the AB correlation function. A binomial read sampling model determines how closely the inferred AB curve should follow the noisy hSNP measurements (error bars: 95% confidence intervals). Phasing hSNPs allows the paternal SNP (blue) VAF to be adjusted to (1 – VAF) to be consistent with the surrounding maternal SNPs, which is necessary to produce long-range allele balance estimates. The shown candidate sSNV, despite achieving very high VAF, is likely an error since it does not match the local amplification balance. e The AB model applied to a 200 kb window around the candidate sSNV shown in (a). The artifact (red) at VAF = 44% is highly inconsistent with the model’s estimated AB of 89% (black line) and falls well outside of the 95% probability interval (gray envelope)

