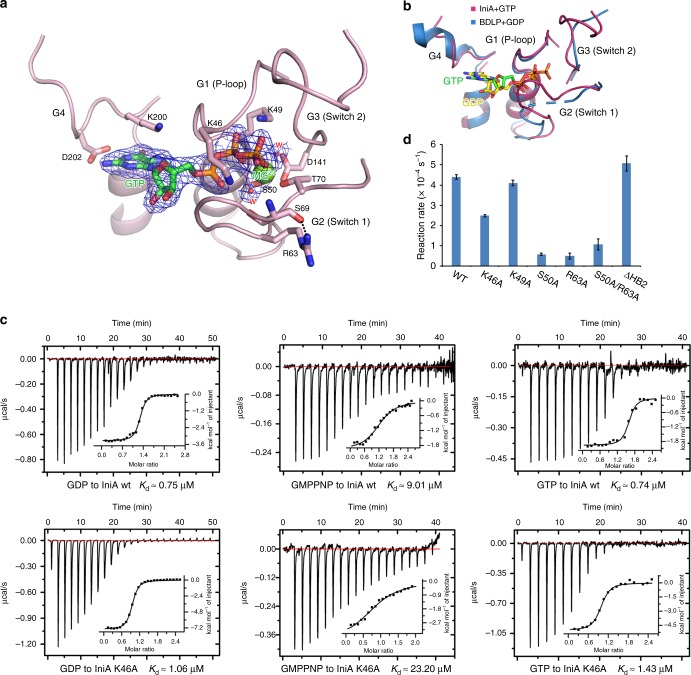
Fig. 2.
Analysis of the GTP-binding site. a The binding of GTP to IniA. GTP and nearby residues are shown as sticks. Mg2+ and water molecules (W) are represented by spheres. The 2Fo–Fc electron density maps (contoured at 1.0 σ) of GTP, Mg2+, and water molecules are shown as wire mesh (blue). The hydrogen bond between S69 and R63 is indicated by the dashed line. b Structural alignment of nucleotides and conserved motifs between IniA and cyanobacteria BDLP. The dashed loop represents un-modeled fragment in BDLP. c Binding affinity of GDP/GMPPNP/GTP for wild-type (wt) IniA and the K46A mutant measured by ITC. The dissociation constant, Kd, is given below. The data are representative of at least three repetitions. d GTPase activity of IniA and different mutants. The activities were measured by the reaction rate at 0.5 mM GTP. Each bar is the mean and SD of three measurements. The source data of Fig. 2d are provided in the Source Data file

