Fig. 5.
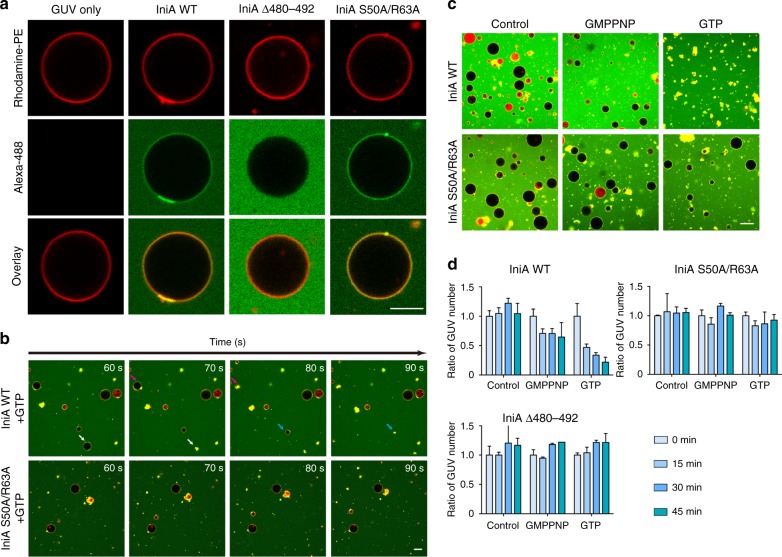
GUV rupture by IniA. a In vitro GUVs (red) binding assays show different binding ability of 15 µM WT IniA, Δ480–492, and S50A/R63A mutants (green). Scale bar, 10 µm. b As shown in (a), WT IniA and S50A/R63A mutant with the time course after 0.5 mM GTP/GMPPNP incubation for 10 min, the arrows indicate the rupture sites. Scale bar, 10 µm. c GUVs treated with 15 µM WT IniA and S50A/R63A mutant in the presence of 0.5 mM GTP/GMPPNP during 45 min, untreated GUVs as a control. Scale bar, 10 µm. d The diagram shows the statistical results in (c), the number of GUVs seen at indicated time points was counted and shown as relative values to that at the start point. Each bar is the mean and SD of three measurements. The source data of Fig. 5d is provided in the Source Data file

