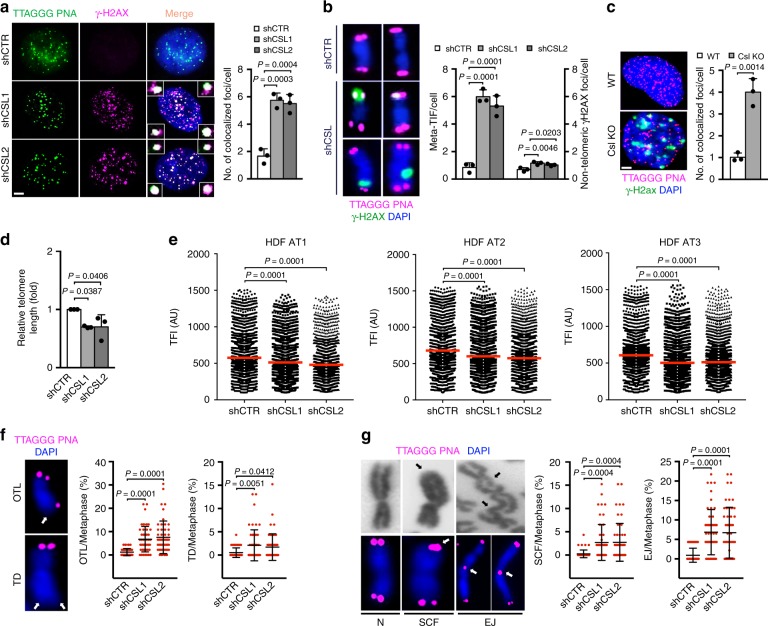
Fig. 3. CSL depletion triggers telomere loss and genomic instability in HDFs and MDFs.
a Telomeric DNA Q-FISH (TTAGGG PNA, green) and γ-H2AX immunostaining (magenta) colocalization signals (foci) in HDFs plus/minus CSL silencing (5 days). Scale bar, 1 μm. Fifty cells per sample were scored. n(strain) = 3, ***p < 0.001, one-way ANOVA. b Telomeric DNA Q-FISH (magenta) and γ-H2AX immunostaining (green) colocalization signals (telomere dysfunction-induced foci, meta-TIF) and nontelomeric γ-H2AX foci in metaphase chromosome spreads from HDFs plus/minus CSL silencing. Additional images are in Supplementary Fig. 2a. Forty spreads per sample were scored. n(strain) = 3, *p < 0.05, one-way ANOVA. c Telomeric DNA-FISH (magenta) and γ-H2ax immunostaining (green) colocalization signals (foci) in dermal fibroblasts from multiple mice plus/minus mesenchymal Csl deletion (WT/KO). Scale bar, 1 μm. >25 cells per sample were scored. n(WT) = 3, n(KO) = 3, **p < 0.01, two-tailed unpaired t-test. d qPCR analysis of average telomere length normalized to the ALBUMIN gene in HDFs plus/minus CSL silencing. n(strain) = 3, *p < 0.05, one-way ANOVA. e Analysis of telomere length by Q-FISH in HDFs plus/minus CSL silencing. Scatter plots show distribution of telomere fluorescence intensity (TFI) in arbitrary units (AU). >3000 telomeres were quantified per sample. Histograms with telomere length distribution are in Supplementary Fig. 2b. n(telomere) > 3000, n(strain) = 3, ****p = 0.0001, one-way ANOVA. f Representative images of one telomere loss (OTL) and terminal deletion (TD) (white arrows) and quantification of the percentage of chromosomes carrying OTLs or TDs per metaphase in HDFs plus/minus CSL silencing. Additional images are in Supplementary Fig. 2c. Mean ± SD, n(spread) = 50, n(strain) = 2, *p < 0.05, one-way ANOVA. g Representative phase contrast (top) and telomere FISH (bottom) images of normal chromosomes (N), chromosomes with sister chromatid fusion (SCF) or with chromosomal end joining (EJ) (arrows), and quantification of the percentage of chromosomes carrying SCFs or EJs per metaphase in HDFs plus/minus CSL silencing. Additional images are in Supplementary Fig. 2c. Mean ± SD, n(spread) = 50, n(strain) = 2, ***p < 0.001, one-way ANOVA. Bars represent mean ± SD

