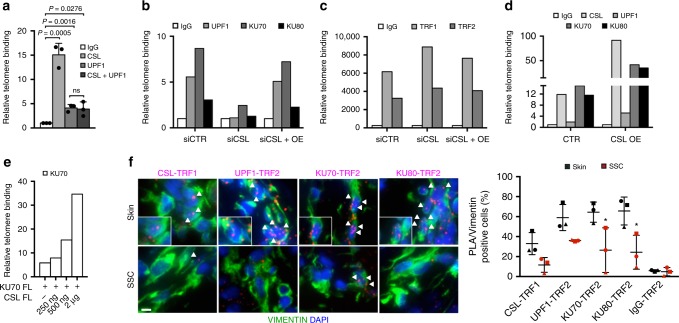
Fig. 7. UPF1/Ku70/Ku80 recruitment to telomeres is impaired by CSL loss.
a Telomere binding assay by ChIP/qPCR with antibodies against CSL and UPF1, individually or sequentially (CSL+UPF1), in parallel with non-immune IgG, in HDFs as in34,35. n(strain) = 3, *p < 0.05, two-tailed unpaired t-test. b Telomere binding assays by ChIP/qPCR with antibodies against the indicated proteins in HDFs (GB1) plus/minus siRNA-mediated CSL silencing (3 days) or CSL silencing and concomitant lentivirally induced CSL overexpression (OE). Similar experiments with two additional HDF strains (GB3 and GB4) are in Supplementary Fig. 8b. c Telomere binding assays by ChIP/qPCR analysis of the same cells as in b with antibodies against TRF1/TRF2. Similar experiments with two additional HDF strains (GB3 and GB4) are in Supplementary Fig. 8c. d Telomere binding assays by ChIP/qPCR with antibodies against the indicated proteins in HDFs (GB1) plus/minus lentivirally induced CSL overexpression (OE) for 3 days. Similar experiments with two additional HDF strains (GB3 and GB4) are in Supplementary Fig. 8d. e Telomere binding assays by ChIP/qPCR with anti FLAG-tag antibodies in HEK293T cells expressing increasing amounts (0, 250 ng, 500 ng, and 2 μg) of FLAG-tagged full length (FL) CSL together with full length (FL) Ku70 (2 μg). Non-immune IgGs were used for normalization. A second independent experiment is in Supplementary Fig. 8e. f PLAs of stromal fibroblasts (identified by VIMENTIN staining) from unaffected skin versus flanking SCC with TRF1 or TRF2 antibodies in combination with antibodies against the other indicated proteins. Scale bar, 5 μm. Quantification of CSL and UPF1/Ku70/Ku80/TRF1/TRF2 levels in the same samples are in Fig. 2b and Supplementary Fig. 8f, respectively. Triangles, circles, and squares point to values from flanking skin (black) and corresponding SCC (red) from three patients. Non-immune IgGs were used as control. Mean ± SD, n(cells) > 77 per condition, n(SCC) = 3, n(matched Skin) = 3, *p < 0.05, two-tailed paired t-test. Bars represent mean ± SD

