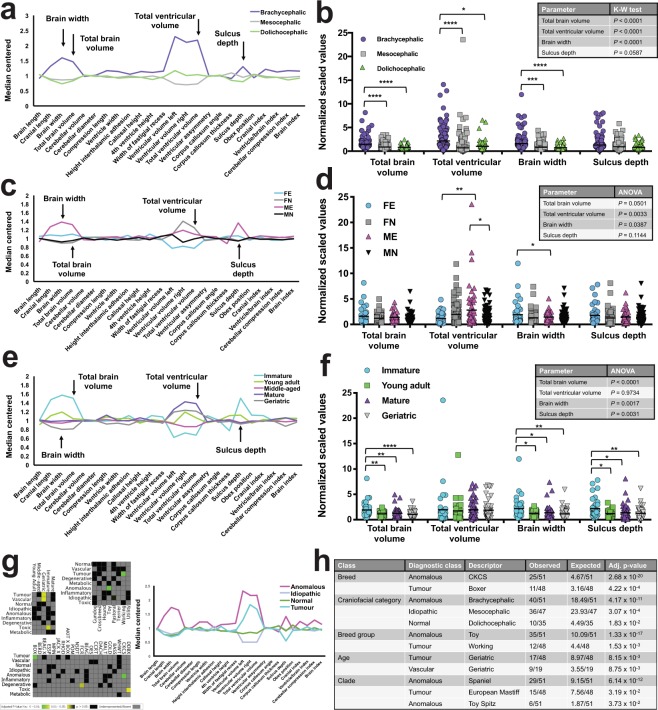
Figure 3.
Signalment and diagnosis impact on canine brain morphometry. Brain morphometry comparisons by (a,b) craniofacial category, (c,d) sex, and (e,f) age category. Arrows in (a,c,e) indicate key morphometric parameters tested in (b) (N = 286), (d) (N = 286), and (f) (N = 179) by one-way ANOVA or Kruskal-Wallis (K-W) test as required. Differences between group means or medians (horizontal bars) are shown in each inset table, with significance depicted in shaded boxes; asterisks refer to multiplicity adjusted P-values by Tukey’s or Dunn’s method (****P < 0.0001, ***P < 0.001, **P < 0.01, *P < 0.05). In (c) and (d) FE = un-neutered females, FN = neutered females, ME = un-neutered males, and MN = neutered males. (g) Heat maps and chart coloured by final neurological diagnosis. Note enrichment of tumour diagnoses with both the geriatric group and Boxer breed. Network graphs for each diagnostic class are visualized separately in Supplementary Figure S10. (h) Enrichment analysis results for diagnostic class sets. Table lists significant enrichments together with expected and observed numbers for each descriptor that occurred in a given class, with adjusted P-values. Enrichments were excluded where observed number of nodes was < three (minimum cluster size). For each class, descriptors are listed in order of statistical significance. No enrichments were found within diagnostic class sets for septal integrity or sex.

