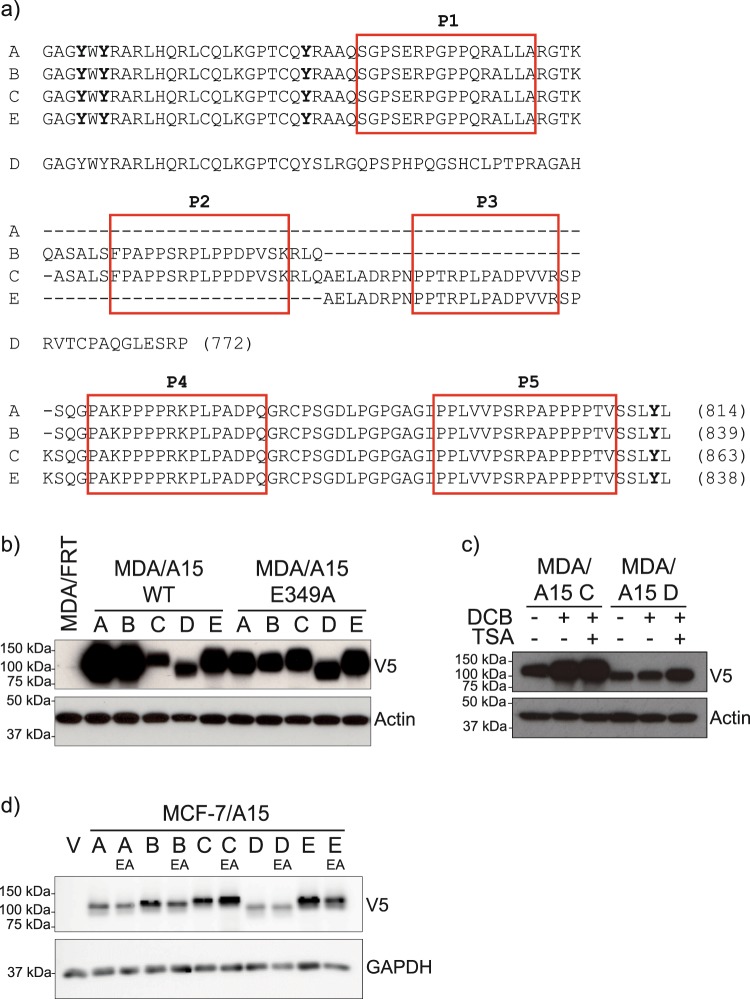
Figure 1.
Isogenic cell panels expressing individual ADAM15 wildtype and catalytically inactive isoforms in MDA-MB-231 and MCF-7 cells. (a) Schematic representation of ADAM15 ICD variants. Proline-rich regions are boxed. (b) Expression of ADAM15 isoforms in MDA-MB-231 cells, (c) MDA/ADAM15 C and D cells treated with 50 µM Decitabine for 72hrs, each 24 hr replacing the media and adding Decitabine fresh. For the last 24hrs, 500 nM Trichostatin A was added, followed by analysis for ADAM15 expression. (d) Expression level of ADAM15 isoforms in MCF-7 cells.

