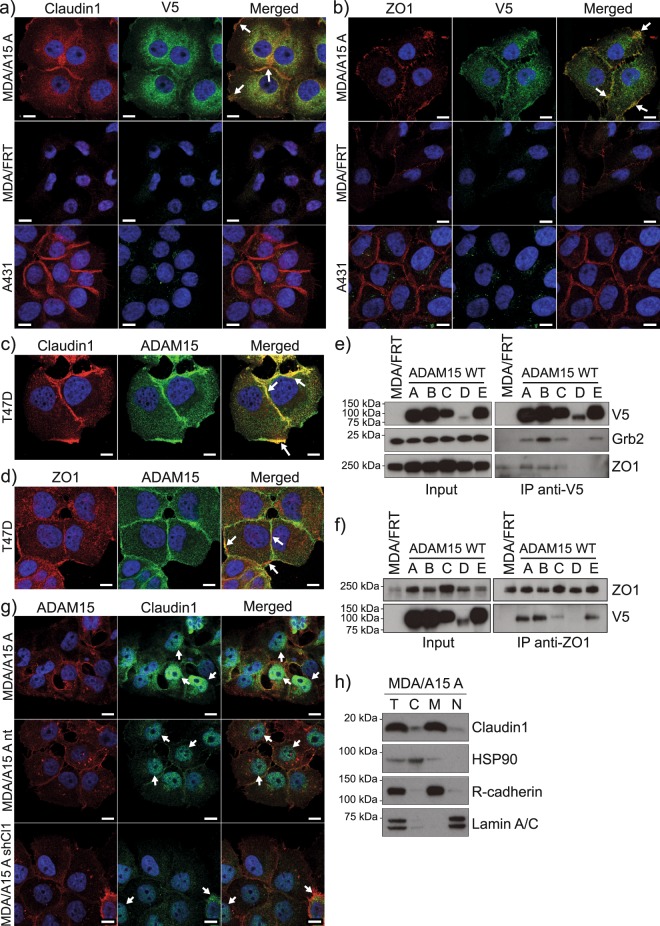
Figure 6.
Complex formation between Claudin-1, ZO1 and ADAM15 in MDA-MB-231 and T47D cells. Co-localisation of overexpressed ADAM15 (V5, AlexaFluor-488, green) and (a) Claudin-1 (AlexaFluor-594, red) or (c) ZO1 (AlexaFluor-594, red) in MDA/ADAM15 A expressing cells. MDA/FRT and A431 cells do not contain V5 tagged ADAM15 and serve as negative control for V5. A431 were used as positive control for claudin-1cell-cell junction localisation. Co-localisation of ADAM15 (AlexaFluor-488, green) with (c) Claudin-1 (AlexaFluor-594, red) or (d) ZO1 (AlexaFluor-594, red) in T47D cells. Example areas of co-localisation are highlighted with arrows. Scale bar = 10 mm. Immunoprecipitation of (e) ADAM15 (V5) and (f) ZO1 from MDA/ADAM15 A-E expressing cells. V5 IP probed with V5, Grb2 (as a positive control for co-IP with ADAM15) and ZO1. ZO1 IP probed with ZO1 and V5. (g) Representative IF images of Claudin-1 localisation to nuclei in MDA/ADAM15A cells. ADAM15 (ADAM15-ECD, AlexaFluor-594, red) and claudin1 (AlexaFluor-488, green) localization in MDA/ADAM15A, MDA/ADAM15A/sh-non-target and MDA/ADAM15A/shClaudin1 expressing cells. Nuclei visualized by DAPI (blue). Scale bar = 10 µm. (h) Subcellular localization of claudin-1 by fractionation analysis of MDA/ADAM15A expressing cells. HSP90 serves as cytoplasmic, R-cadherin as membrane and Lamin A/C as nuclear control. T = Total cell lysate; C = cytoplasmic fraction; M = Membrane fraction; N = Nuclear fraction.

