Figure 5.
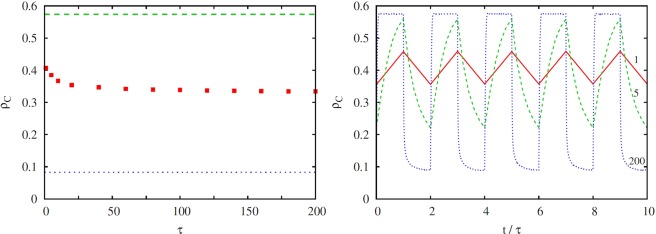
Stationary density of cooperators ρC in dependence on the periodic time τ, obtained when both payoff pairs fall into the snowdrift quadrant (left panel). We have used (T1 = 1.3, S1 = 0.7) and (T2 = 1.7, S2 = 0.3), whereby the corresponding ρC values (if either payoff pair would be applied permanently) are marked by horizontal dashed lines for comparison. It can be observed that the ρC value of the game with seasonal variations is more or less exactly the average of the two games that are alternated, and this regardless of the value of τ. Only when τ is very small is the relaxation in both cases not fast enough and so the average diverges towards the snowdrift game with a slightly faster relaxation [governed by (T1, S1), more supportive of cooperation, marked by the green dashed line]. The right panel shows the time evolution of the cooperation level fC in the stationary state, as obtained for different values of τ using the same payoff pairs as in the left panel. The applied values of τ are indicated alongside the corresponding lines. For a proper comparison we have used a normalized time scale in 1/τ units. It can be observed that the relaxation dynamics is always (in both periods) relatively fast, indicative of the fast emerging locally ordered role-separating checkerboard patterns that govern both instances of the applied snowdrift game.

